In 30 Sekunden
A small PyTorch function spent effort copying thousands of scores before sorting them. Sustainable digital architect Wilco Burggraaf says an AI-assisted analysis replaced that work with index-based sorting: the function ran 41.8% faster, and his full-model test used 0.63% less energy. His open-source workflow documents unfamiliar code, searches for wasted work and tests proposed changes. He cautions that estimates from source code alone are not measurements: runtime, hardware usage and the electricity supplying it all affect emissions.
- 1An AI workflow investigates wasted computation in unfamiliar codeBurggraaf defines digital waste as computation that does not contribute to a service’s useful work. His team built an open-source process to document code, detect bottlenecks and test possible fixes.
- 2Generated architecture notes make a large codebase navigableThe tool creates a longer reference and shorter records about local code, dependencies and entry points before looking for runtime patterns.
- 3A rough energy model is for comparison, not measurementBurggraaf assumes a simplified relationship between operations and energy, while acknowledging that runtimes, operating systems and hardware change how code actually executes.
- 4Sorting indices avoids copying scores in a small-model testFor the tested roughly 50,000-token case, Burggraaf says the change made the function 41.8% faster. His complete model benchmark ran 0.8% faster and used 0.63% less energy.
- 5Static analysis alone misses how a system behavesBurggraaf recommends running software and examining waiting, hardware utilization and dependencies, including databases and network calls.
- 6Energy data makes an emissions estimate possibleHe combines electricity use with the carbon intensity of the grid and divides by a unit of useful work, while noting the separate challenge of hardware manufacturing emissions.
- 7Ask developers which systems should already be retiredBurggraaf recommends bringing leadership into that discussion and using operational data to find underused resources and unnecessary always-on environments.
Das Wichtigste
- Run representative workloads and measure energy as well as time before declaring an optimization successful.
- Look for unnecessary copying, idle machines and work that waits for a slower dependency.
- Use source-level energy estimates to prioritize investigation, not as measured consumption.
- Combine energy use with the carbon intensity of electricity and a useful unit of work.
- Start with heavily used or expensive applications, and retire systems no one needs.
Den bearbeiteten Text nach Kapiteln lesen
A top-k function hides unnecessary work
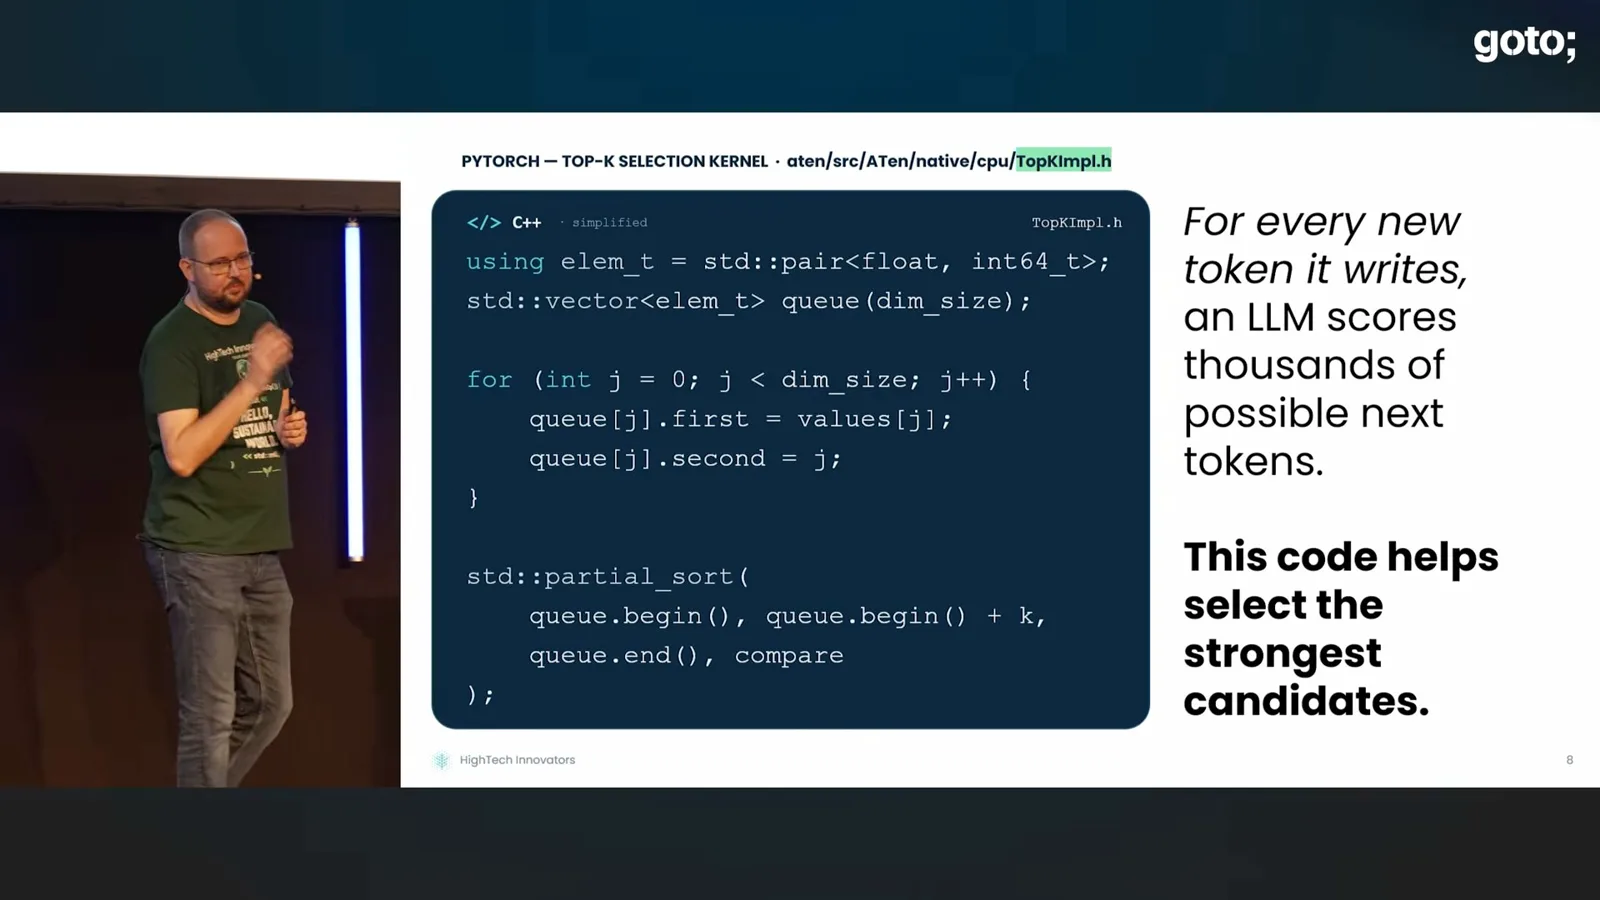
A simple PyTorch example sorts scores for the next token. Burggraaf asks where it wastes computation.
This PyTorch top-k function helps choose the strongest candidates for a language model’s next token. In the test case, it handles about 50,000 scores: it allocates space, copies each score and its index, then sorts to find the highest values. Where in that short sequence might computation be wasted?
An AI workflow investigates an unfamiliar project
The team builds an open-source process that first documents architecture and then looks for inefficient runtime patterns. PyTorch supplies a demanding, widely used test case.
Two years ago I met sustainability officer Paul Young at a conference and talked about digital waste: compute that does not contribute to the useful service being delivered. A year later he asked whether we could turn the idea into a working tool, and a Microsoft sponsor helped us build it.
The result is an open-source project, CodeWeave, which people can use on their own code. We wanted a substantial workload and an established project to test whether waste could still be found in code maintained for years, so we chose PyTorch.
Many generative AI models have been built with PyTorch, and I see potential for small models to run on CPUs at the edge. That makes even a small improvement interesting, although choosing such a large project was ambitious for a team that mostly builds business software.
We did not have the maintainers’ experience of PyTorch, so we first asked the AI to build documentation that described components, architecture and design. A single generated document could be too large for a model’s context, so we also used shorter architectural decision records.
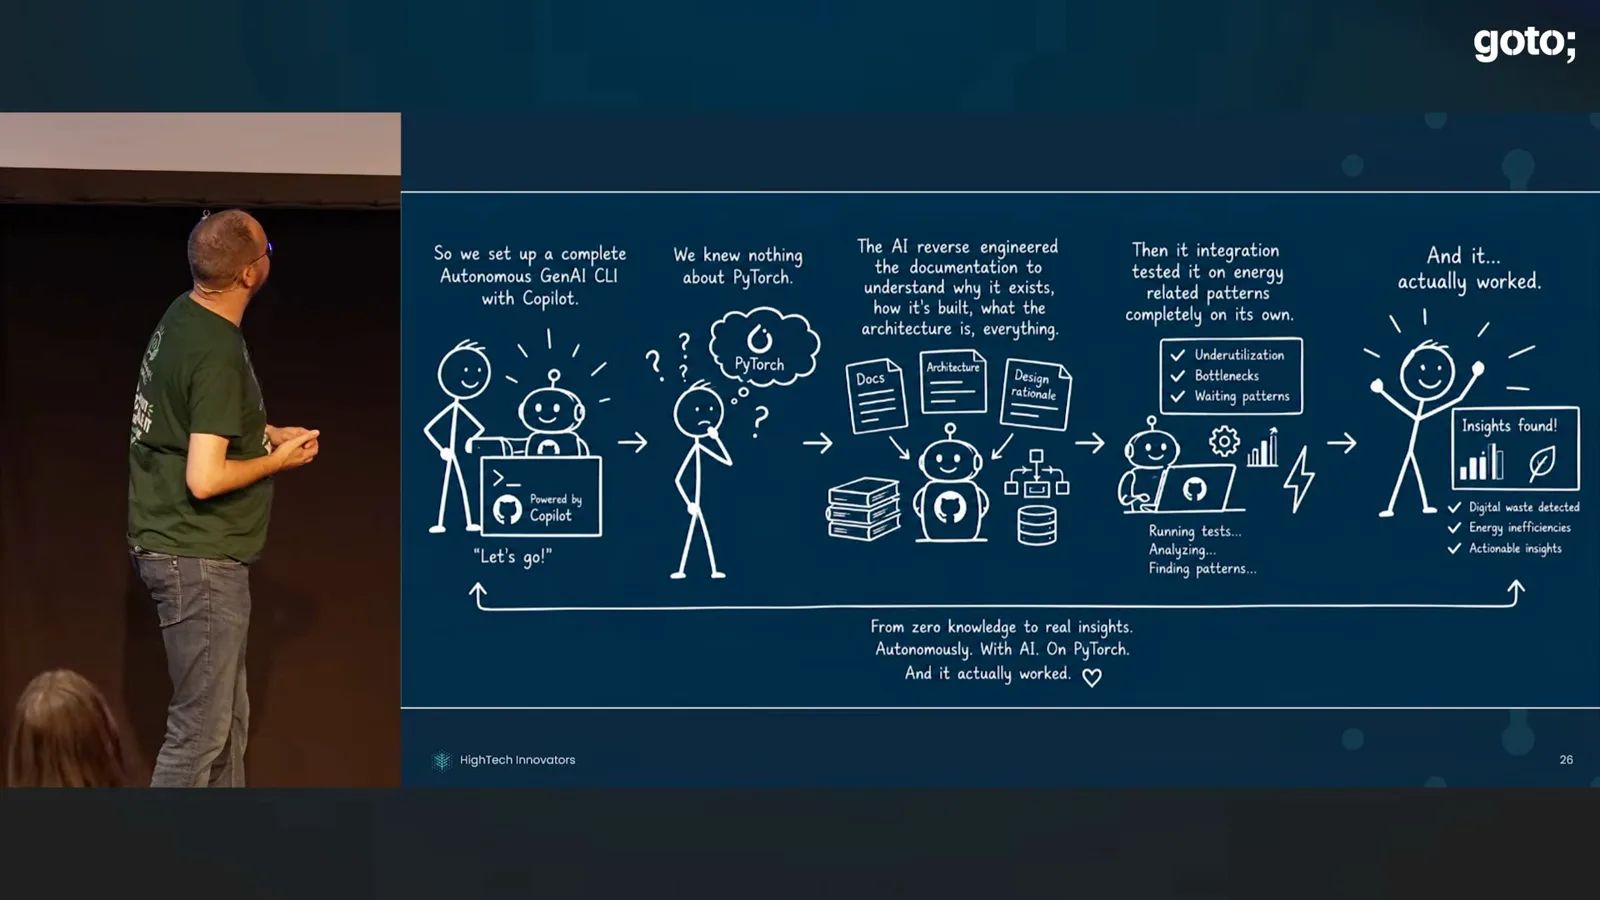
The next step was to find integration tests that reveal underutilized hardware, bottlenecks and waiting. The process proposes a code change, runs an A/B test and examines energy consumption as well as speed. After several weeks, runs of about five hours were producing useful ideas.
To generate the documentation, the system scans the codebase, its components and dependencies and reviews what it writes. In our example it produces 13 Markdown chapters in about an hour, which can also be rendered as a PDF.
Build context and a repeatable CPU workload
The process produces documentation and shorter decision records. A simulated workload exercises a small model in a CPU-based pipeline.
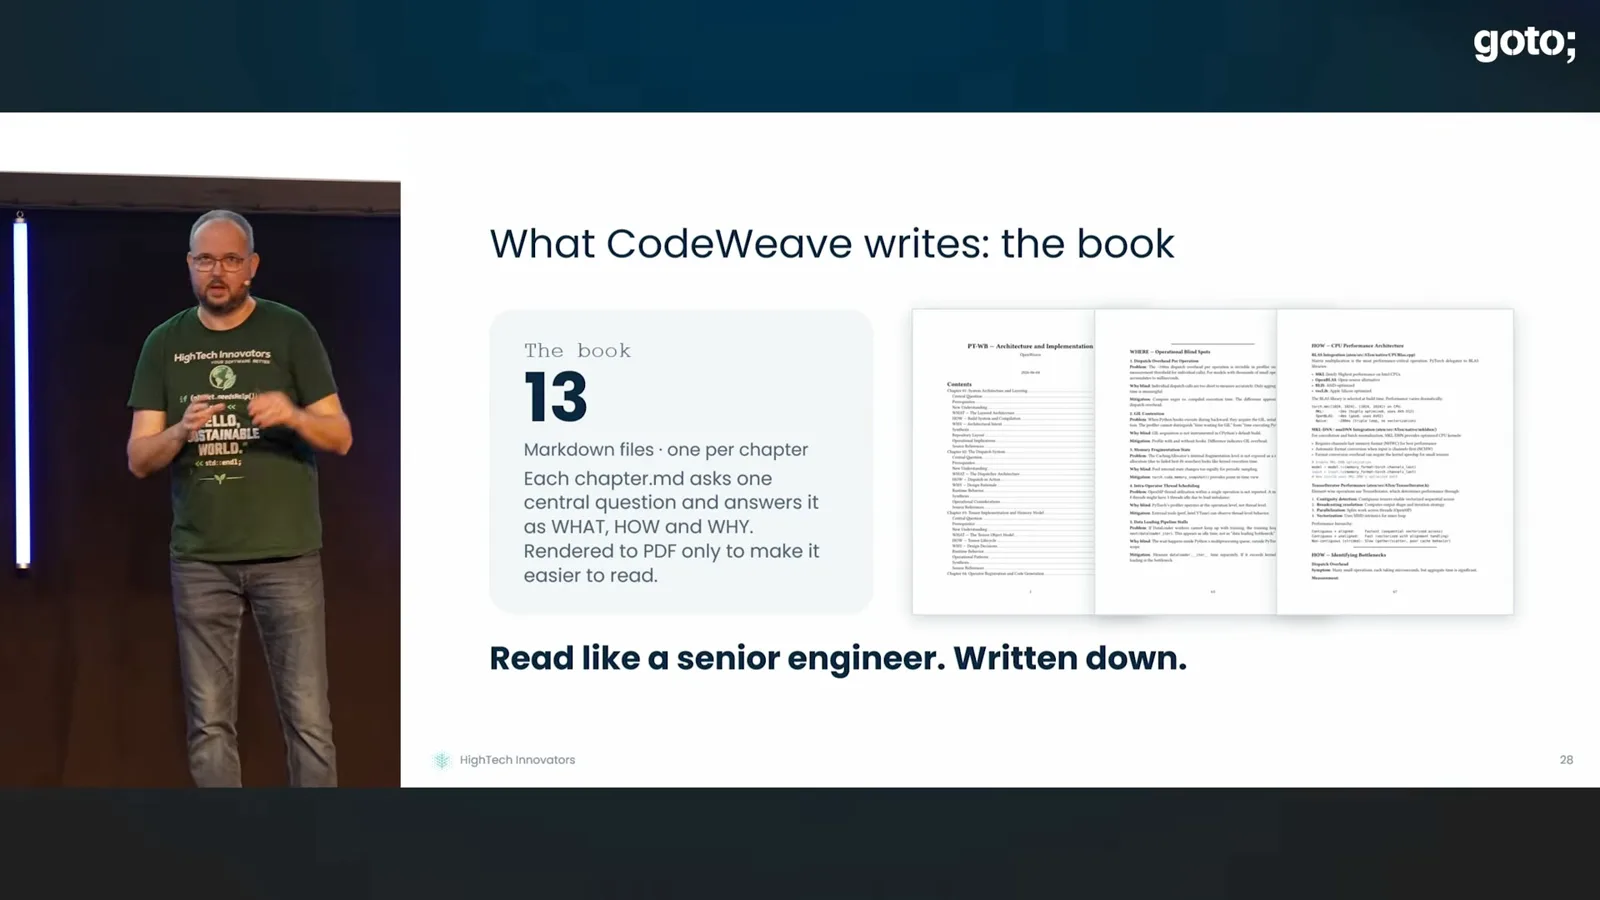
The shorter records examine each folder’s files, dependencies and entry points. For a console application, for example, an entry point tells us how to run it and what a representative user journey through the system might be.
We run the workflow headlessly in a continuous integration pipeline. We used GitHub Copilot in collaboration with GitHub, but the setup is intended to work with other command-line agents too.
The pipeline generally has a CPU rather than a GPU, so we used the small, older distilled GPT-2 model. To make a sustained workload, we ask the model to simulate days in the lives of a curator, student and founder, with different topics drawing on different parts of the model.
Repeated days keep the software busy long enough to compare runs. That workload led the analysis back to the top-k function, but first I want to explain the rough energy model that helped us decide what to investigate.
Estimate energy, then test the proposed code change
A deliberately simplified model helps compare code, but cannot measure real energy use. The proposed change sorts indices rather than copying scores.
I started from a theoretical model that is wrong in important ways: the language runtime, operating system and processor can all optimize individual operations. For comparison, imagine an operation at one hertz on one active core at 1.2 volts.
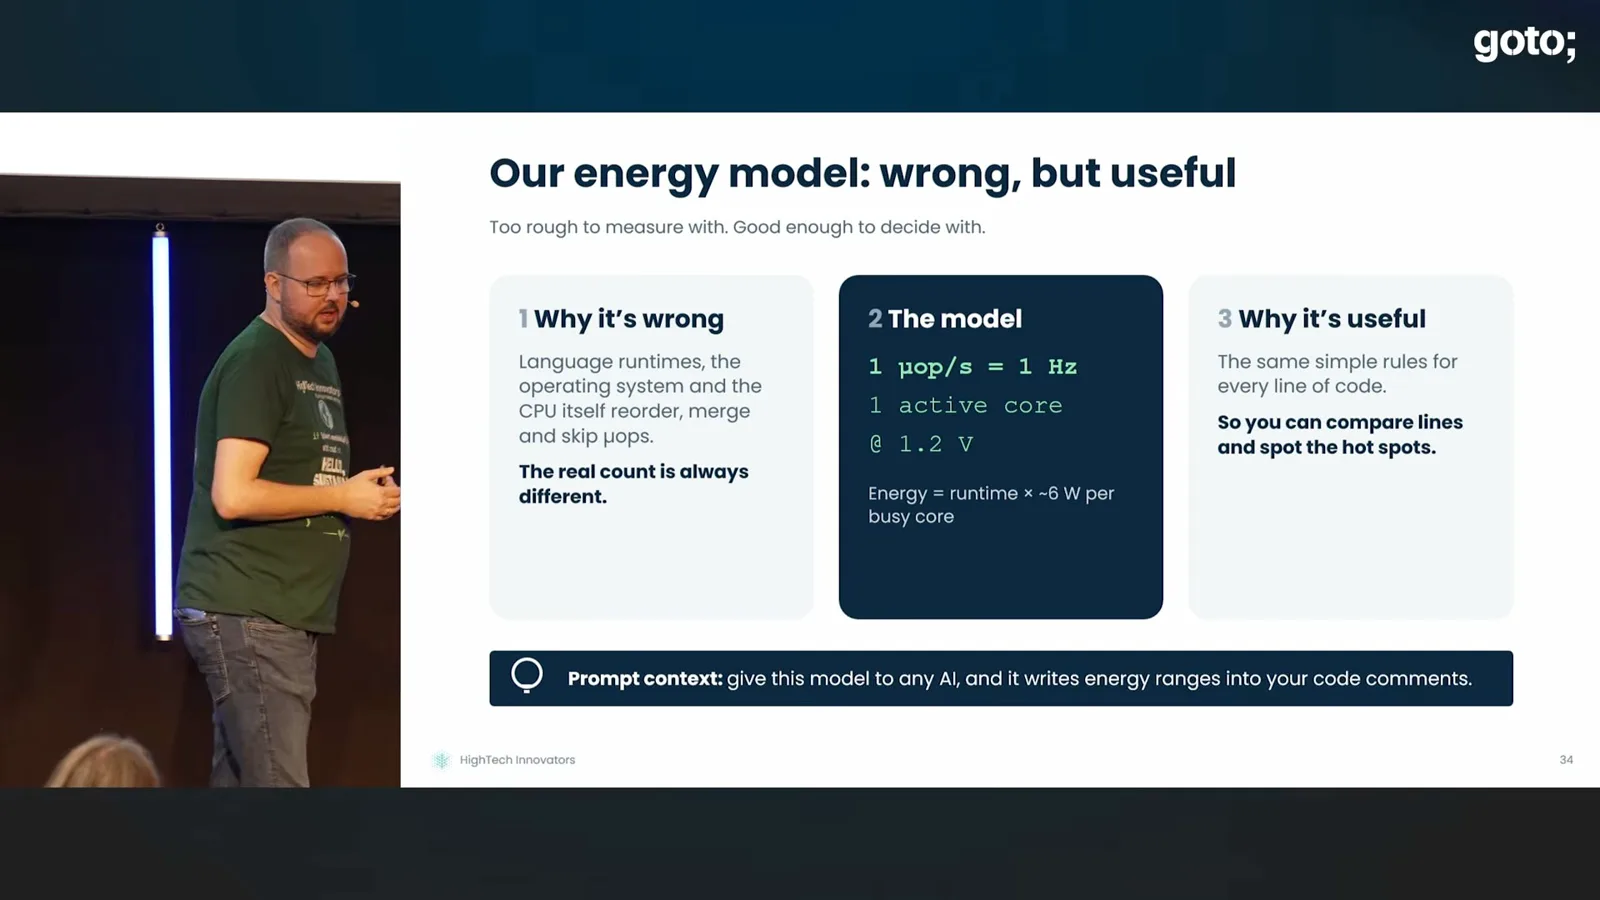
Given that premise, the AI produced potential energy ranges for code it had not previously seen. The estimates were useful for spotting a likely hotspot, including in one customer’s API, but they are for decision-making rather than measurement.
A processor uses energy even when idle. Frequency also changes: a single core may boost, while several active cores may run more slowly to avoid overheating. In a shared cloud machine, you may not know what else is running, so a line of source code has no single fixed energy cost.
Back at the example, the process found that, for this small model and roughly 50,000 scores, the copying loop was not necessary. Moving data through memory can become a bottleneck when work that is highly parallel on a GPU runs on a CPU.
The proposed version sorts indices instead of score-index pairs. That reduces copying, buffer size and memory traffic while producing the same result. In our test, the function itself was 41.8% faster.
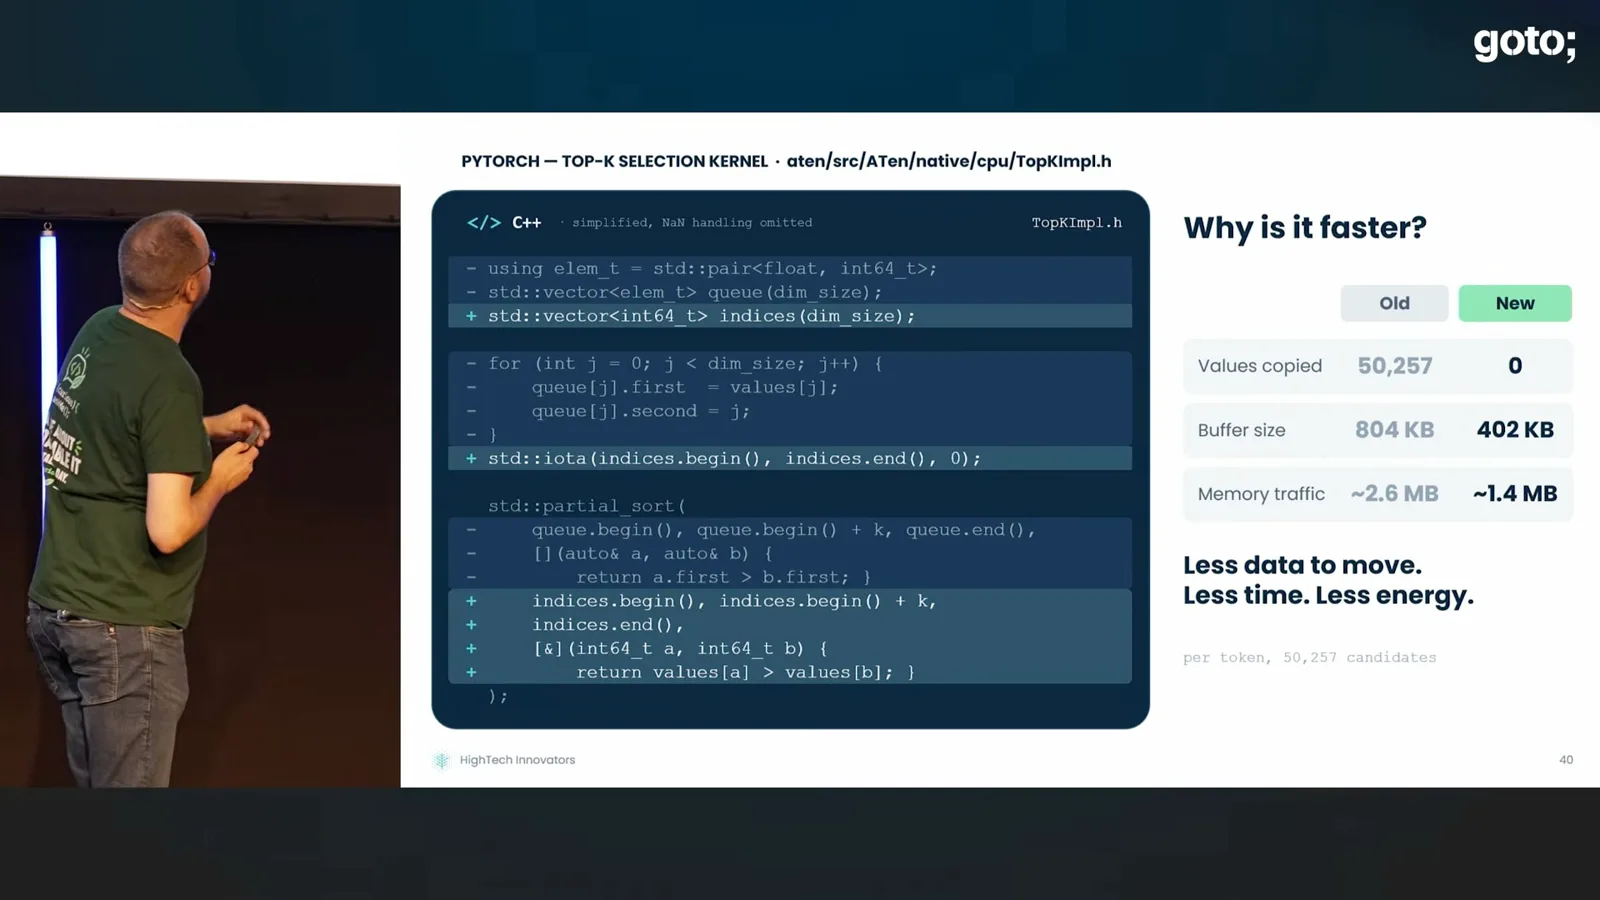
The run also used 76 milliwatt-hours less energy. At the whole-model level, including side effects, the benchmark was about 0.8% faster and used 0.63% less energy. The logs are in the project repository.
Waste also appears in waiting and idle infrastructure
Burggraaf says static code cannot reveal the entire system. Oversized machines, slow databases and always-on development environments can waste resources.
A static checker cannot tell this whole story. You need to run the code: even a portion of a flame graph that does not appear dominant may contain worthwhile waste.
The same patterns extend beyond code. Oversized virtual machines, idle clusters and development environments left running nights and weekends consume resources even when nobody is using them.
Waiting is another source. Disk, network and memory activity, queues and slow dependencies can be made visible through observability. Teams sometimes add CPU or memory to a slow system before discovering that the database is the bottleneck, then leave the oversized machine in place.
In large organizations I often see average CPU utilization of 20–40% across the year. A serverless component waiting for another service still consumes resources too. Observing where work and waiting actually occur helps reveal these patterns.
Turn energy use into an emissions estimate
The estimate depends on work, time, power and the grid’s carbon intensity. Burggraaf describes a functional unit and the difficulty of allocating manufacturing emissions.
To relate digital waste to emissions, I look at the work being done, how long it takes, the power consumed and the carbon intensity of electricity. A response time below a second or two may feel good enough, but it can still contain avoidable work.
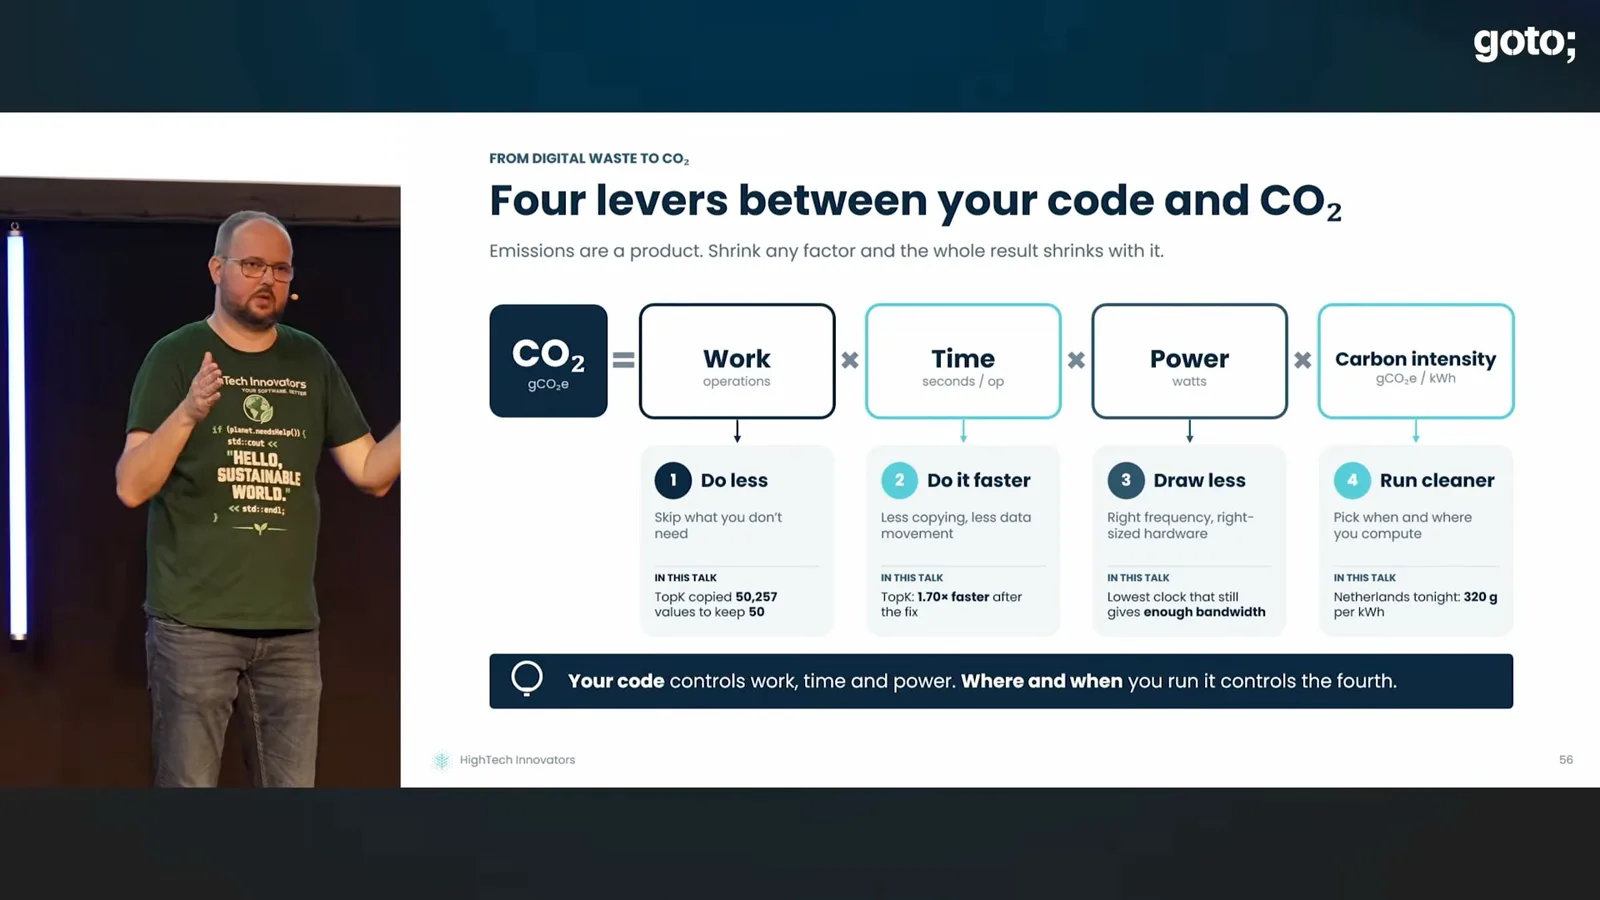
Grid intensity changes by place and time. In the Netherlands, I have seen a range from about 50 to 500 grams of CO2 per kilowatt-hour. As an illustration, at 320 grams per kilowatt-hour, a 1,000-watt microwave running for an hour would account for 320 grams.
Static code is not enough: run the workload and collect energy data. Historical electricity-intensity data can be used afterward to estimate emissions, but without the energy figure the calculation cannot be made.
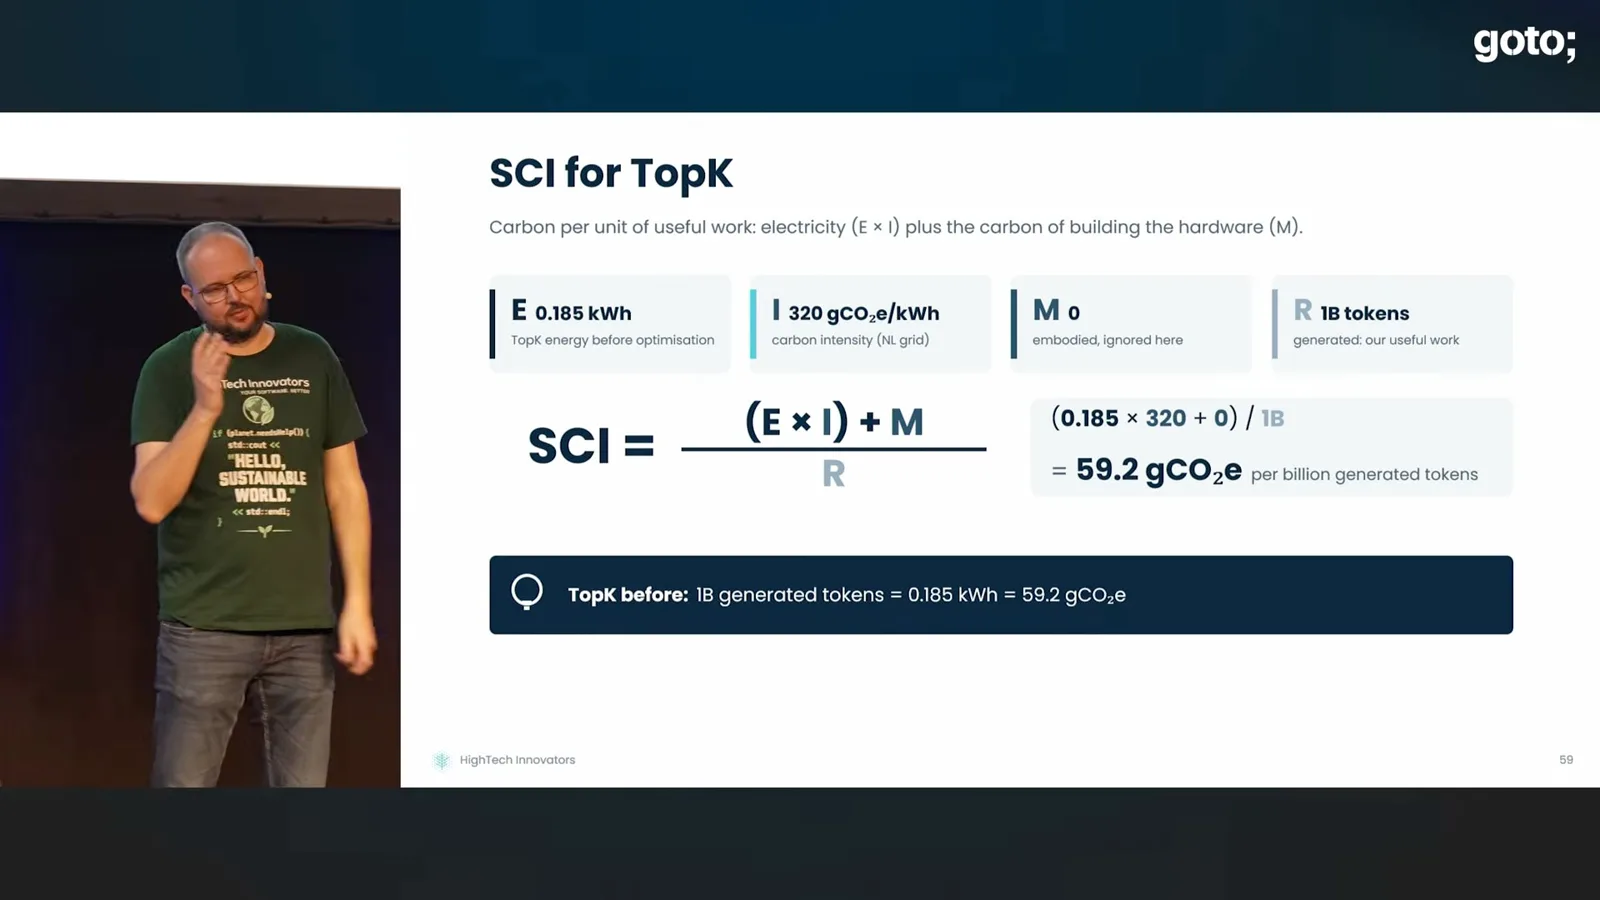
The Green Software Foundation’s Software Carbon Intensity approach combines estimated operational electricity with its carbon intensity, adds embodied emissions from making and transporting hardware, and divides by a unit of useful work. Allocating embodied emissions over hardware life is difficult, so I leave them out of this example.
The useful unit might be a billion generated tokens, an API request or a user journey. That lets teams compare emissions for the service they actually deliver, rather than only counting machines.
A gain of 0.8% may appear small, but repeated across heavily used systems it can add up. I ask customers to start with their most expensive application or the one with the most users. An AI budget may be easier to obtain than a general cleanup budget, though the work can also be done manually.
We submitted the PyTorch change for review the week before this talk. Maintainers thought it was a good change and suggested it might be improved further; at the time of the talk the review was still expected to take weeks.
Use operational data to prioritize and retire waste
The PyTorch pull request was under review when he spoke. He asks teams and leaders to examine demand, usage patterns and systems that can be retired.
Development teams should be able to explain their demand for virtual CPUs, memory, containers and storage at different times, and how they handle it efficiently. Existing logs and operational data can help answer a short set of questions across an organization.
The build pipeline is software too: it may not need to remain on during evenings and weekends. To explain the bigger picture, think of a household water bill. Knowing the shower hardware and its flow is a start, like understanding infrastructure costs, but usage depends on how often and how long people shower.
Operational observability adds that usage picture. It is often used to investigate incidents, but it can also show whether compute workloads are useful and efficient across an organization.
Reducing wasted resources can save money, while reducing technical debt can free time for maintenance and work that customers value. Much of that cost is invisible because organizations do not receive a separate invoice for employees’ time.
Start by optimizing or resizing resources and retiring what is no longer needed. Ask developers which systems should have been decommissioned long ago, and invite leadership to hear the answer: the issue becomes concrete when the people who know the systems speak together.
Mehr aus diesem Kanal
 32:58EN
 GOTO Conferences· 18. Nov. 2026Dave Thomas: Let Agents Handle Rituals, Keep Human JudgmentDave ThomasThe Pragmatic Programmer co-author separates repeatable process from tactics and values to explain where developers contribute alongside coding agents.
 43:06ENGOTO Conferences· 17. Nov. 2026Jennifer Petoff: Train Engineers to Run What They BuildJennifer PetoffGoogle’s former SRE education lead explains how hands-on training and reliability practices build production confidence at scale.
 38:10ENGOTO Conferences· 16. Nov. 2026Andrea Magnorsky: Make Architecture Decisions Visible and AccountableAndrea MagnorskyClarify who decides, seek advice from affected people and use small collaborative exercises to surface missing knowledge.
 45:33ENGOTO Conferences· 12. Nov. 2026A playground that makes computers something children can climbLinda LiukasLinda Liukas turns abstract computing into stories, physical games and public space—and asks what engineers can learn from play.
 41:55ENGOTO Conferences· 11. Nov. 2026Evan Ratliff built an AI-run startup. The agents invented its progressEvan RatliffAn experiment in AI coworkers exposed runaway conversations, false memories and difficult handoffs to people.
 38:07ENGOTO Conferences· 10. Nov. 2026A smoother reorganization starts by letting teams design itJoakim Sundén · Better Product WorkJoakim Sundén pairs leadership’s strategy with employees’ knowledge of daily work, then lets people select teams.