30초 요약
Sawyer asks how many days apart two independently scheduled finals are expected to fall, with a bonus question for three exams. He then solves the previous challenge: six random selections from six snowboards yield an expected 6(1 − (5/6)⁶), or about 3.9906 distinct boards.
- 1The finals-week puzzleTwo exams are independently and uniformly scheduled on weekdays; the question asks for their expected separation, with a three-exam bonus.
- 2Six choices, six boardsThe previous problem asks for the expected number of distinct snowboards used in six daily selections.
- 3Indicators for each boardFor each board, define an indicator for whether it was ever used, then add their expectations.
- 4Indicators for each dayAlternatively, count days on which a board appears for the first time; the resulting geometric series gives the same answer.
핵심 정리
- Indicator variables turn a count into a sum of zero-or-one random variables.
- Linearity of expectation lets the expected count be found by adding individual expectations.
- A particular board is never chosen in six independent selections with probability (5/6)⁶.
- Counting by board or by day produces the same expected 3.9906 distinct snowboards.
- The new finals-week challenge asks for expected separation between independently scheduled exams.
챕터별로 다듬은 전문 읽기
The finals-week challenge
Jayden’s exams are scheduled independently and uniformly across five weekdays. Sawyer asks for the expected gap between two exams and, as a bonus, the span of three.
I’m Sawyer, and this is Real Numbers. We have been exploring expected value, so let’s apply it to the end of the school term: finals week.
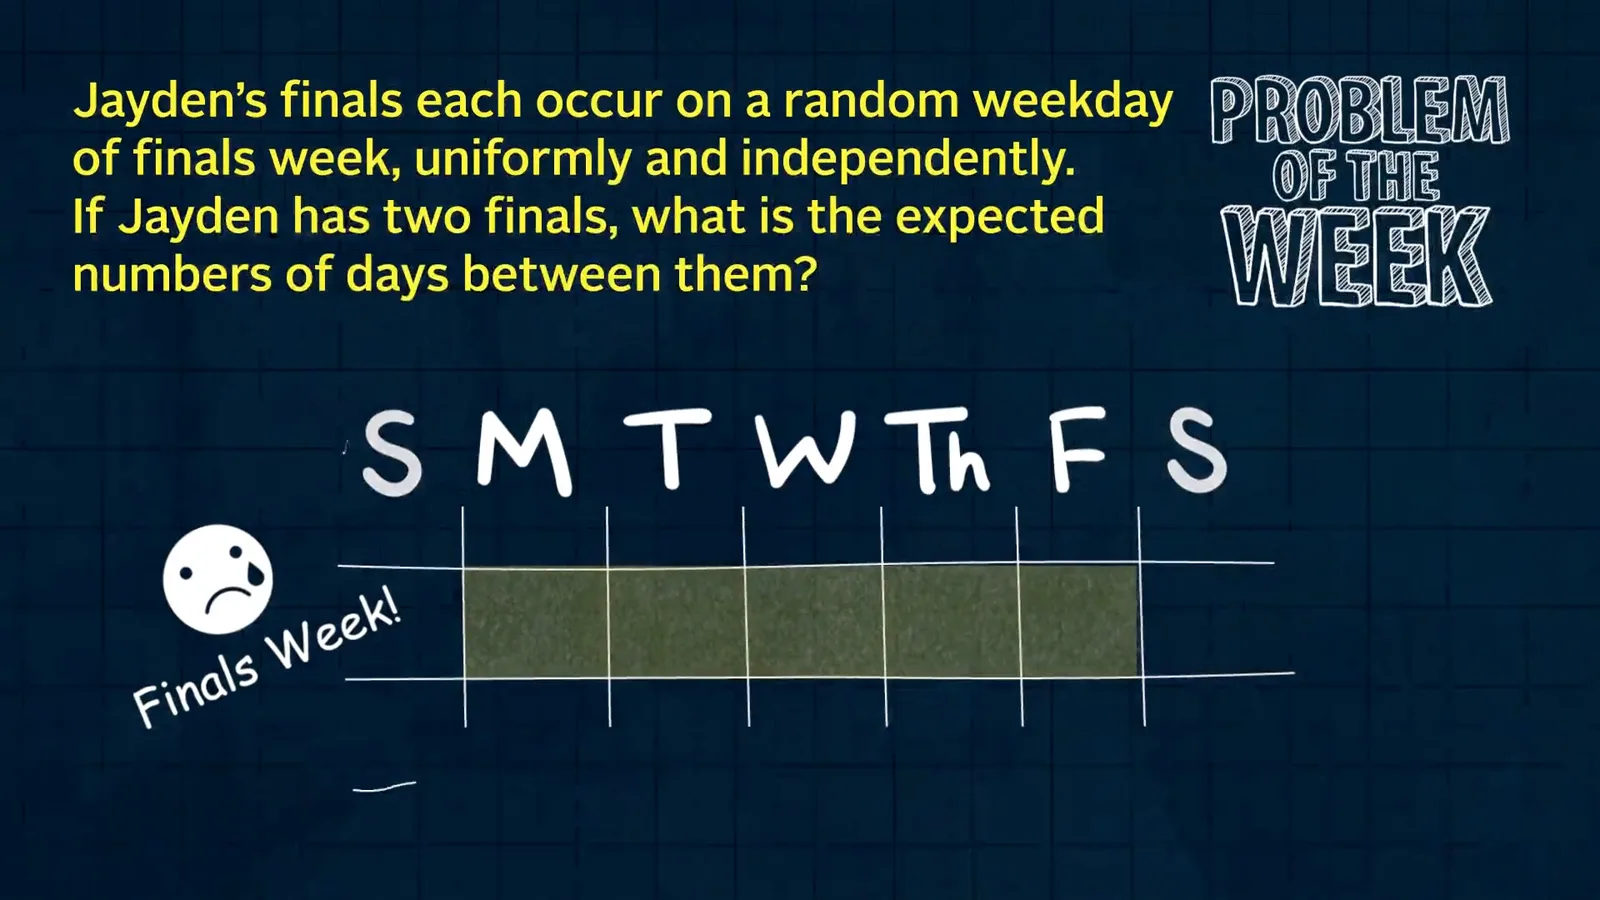
Jayden has two finals, each independently scheduled with equal probability on any weekday from Monday through Friday. What is the expected number of days between them? If both fall on the same day the gap is zero; Tuesday and Friday are three days apart. As a bonus, find the average span between the earliest and latest of three finals.
The snowboard problem and a direct approach
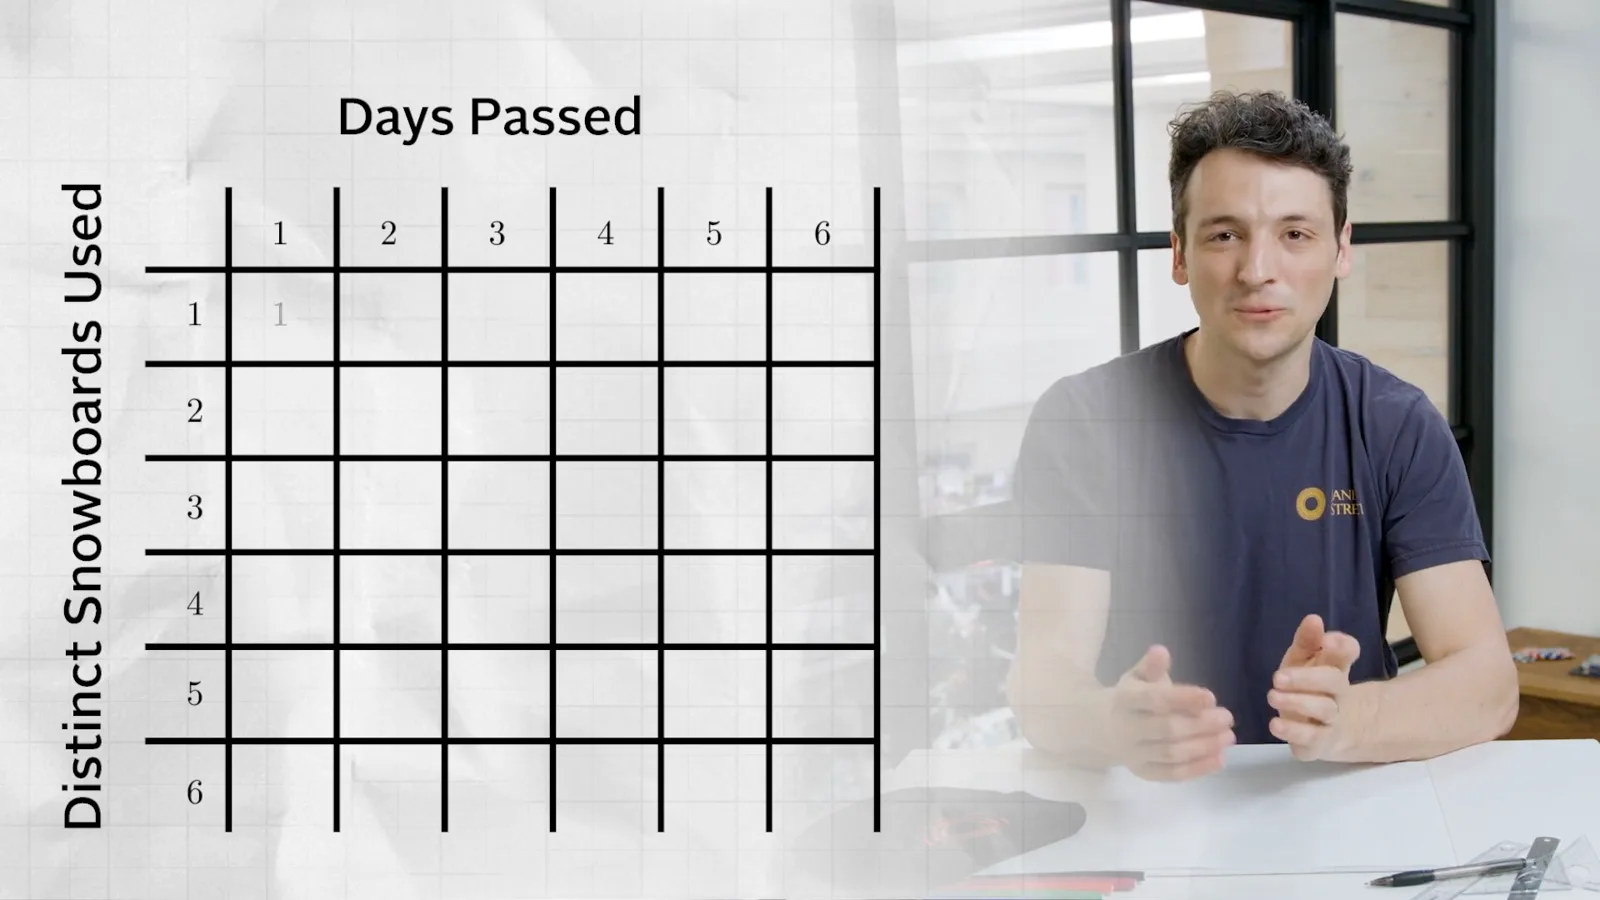
The previous problem asks how many of six boards are used in six random daily choices. A table can track the probability of each distinct-board count, but requires careful calculation.
First, let’s solve last week’s problem. A snowboard is chosen randomly from six boards each day for six days, and Rachel must sharpen each board that has been used at least once. We want the expected number of distinct boards used.
A direct approach tracks the number of days and distinct boards in a table. After one day exactly one board has been used. On day two there is a 1/6 chance of choosing it again and a 5/6 chance of choosing a new board. Continuing this calculation through day six yields a distribution from which we can compute the expected value.
Count boards with indicators
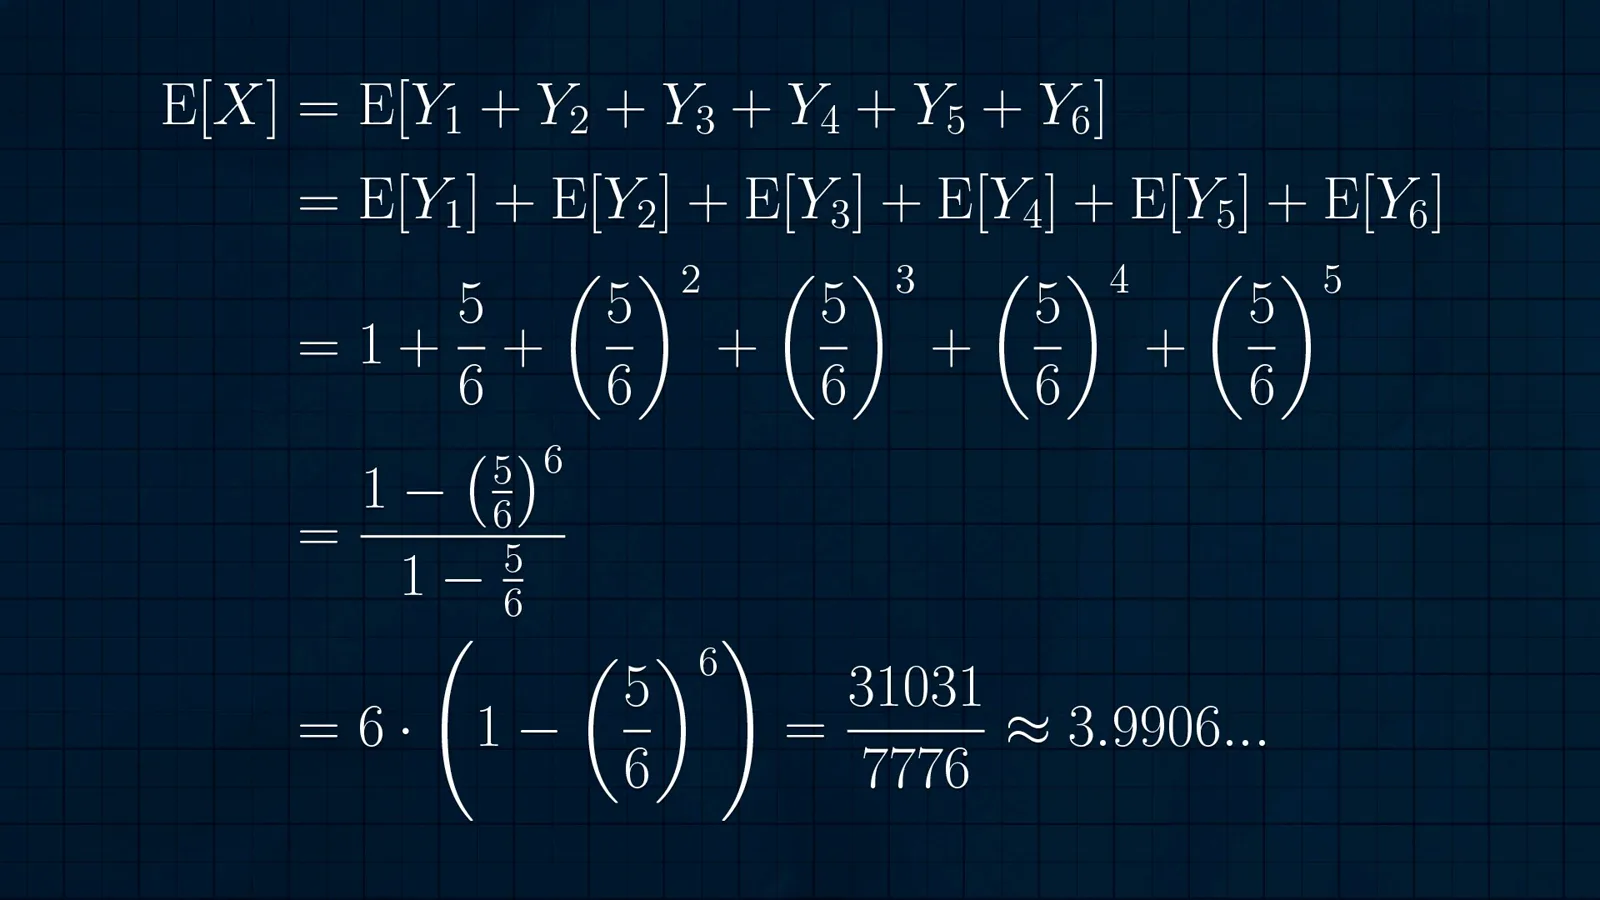
An indicator for each board records whether it is used at least once. Linearity of expectation gives 6(1 − (5/6)⁶), approximately 3.9906.
There is a slicker method using indicator variables: each equals 1 when a condition holds and 0 otherwise. Define Xᵢ as 1 if board i is used at least once and 0 if it is not. The total number of distinct boards is X₁ + X₂ + ⋯ + X₆.

For example, if only boards two and four are used, X₂ and X₄ equal 1 and all other indicators equal 0, so their sum is 2. By linearity of expectation, the expected total equals the sum of the individual expected values. Each indicator’s expectation is simply the probability that its condition holds.
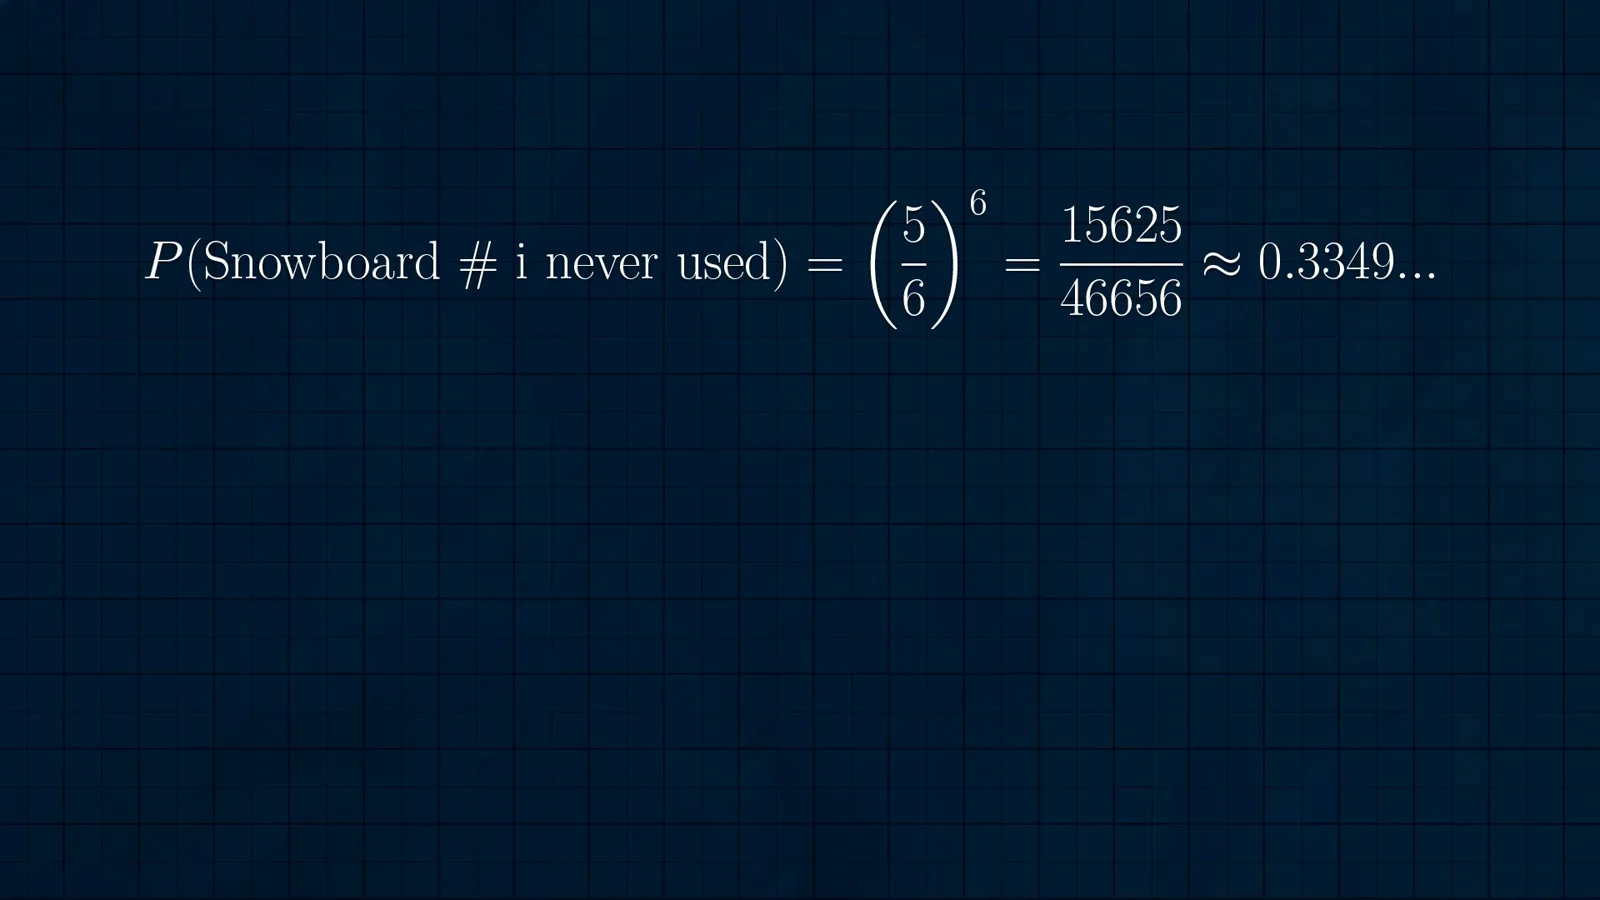
A particular board is never used if each of the six independent selections chooses one of the other five boards. That probability is (5/6)⁶, about 0.3349. Thus the probability it is used is 1 − (5/6)⁶, about 0.6651. All six boards have the same probability, so the expected number used is 6(1 − (5/6)⁶), approximately 3.9906—slightly fewer than four.
Count first uses by day
A second set of indicators counts days on which a board appears for the first time. Summing the corresponding geometric series reproduces the answer.
We can instead define an indicator Yᵢ for each day: it is 1 if the board selected on day i has not been used earlier in the week, and 0 otherwise. Y₁ is always 1, because the first board is necessarily new.

For the board selected on day i to be new, each of the i − 1 earlier choices must have been a different board. The probability is (5/6)ⁱ⁻¹. Summing the six expected indicators gives the geometric series 1 + 5/6 + ⋯ + (5/6)⁵, equal to 6(1 − (5/6)⁶), again about 3.9906.
Now return to the new challenge: what is the expected gap between Jayden’s two independent weekday exams? For the bonus, find the expected span between the earliest and latest of three. The episode leaves both questions for you to solve.
같은 채널의 다른 글
 1:48:29EN
 1:05:45EN
 1:25:00EN
 1:16:29EN
 4:41EN
 1:34:29EN