30 秒でわかる
In this April 2024 short, Matthew Berman describes a preview of Grok’s visual capabilities. The video shows a handwritten flowchart translated into Python and an explanation of a meme comparing startups with large companies; these are selected examples, not a broad evaluation.
- 1A vision previewBerman introduces early examples of Grok processing images.
- 2Diagram to codeA handwritten guessing-game flowchart is used to generate Python code.
- 3Explaining a memeThe model describes a joke contrasting how startups and large companies are depicted at work.
ポイント
- The preview shows a handwritten flowchart used as input for Python code generation.
- A second example describes and interprets a workplace meme.
- Two demonstrations cannot establish reliability across all images or programming tasks.
チャプターごとに整えた全文を読む
Two visual examples
Berman shows a diagram-to-code example and a meme explanation. The examples illustrate potential uses without establishing general performance.
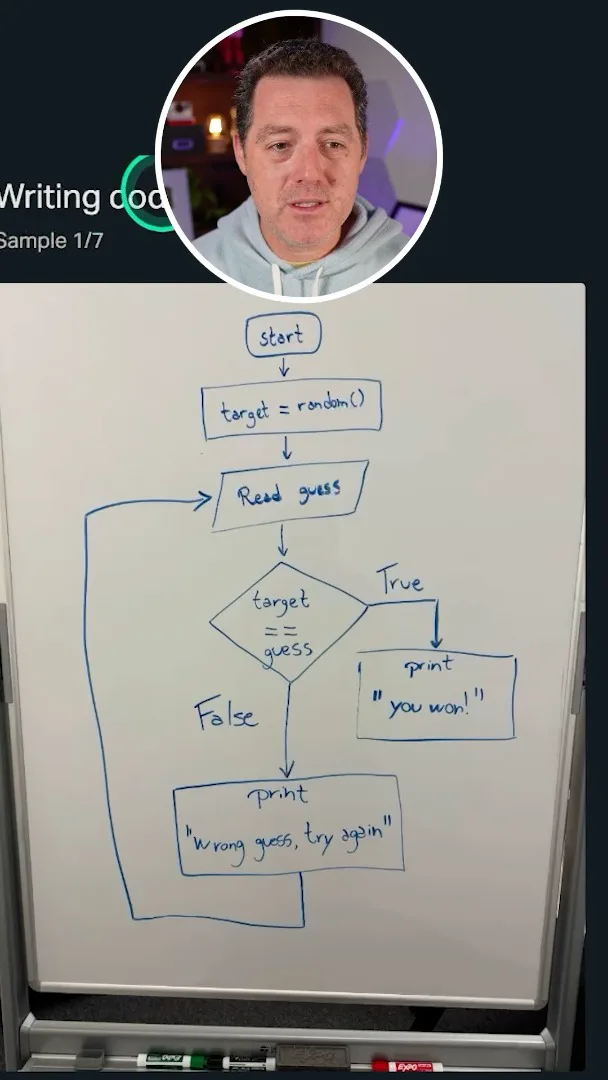
Grok has previewed visual capabilities, and I review two examples in this short. The first asks the model to translate a handwritten whiteboard workflow into Python code.
The flowchart describes a guessing game: choose a target, read a guess, check whether it matches, and either announce a win or ask the user to try again. The preview shows a Python response to the diagram; it is a demonstration, not a verified test of every generated program.
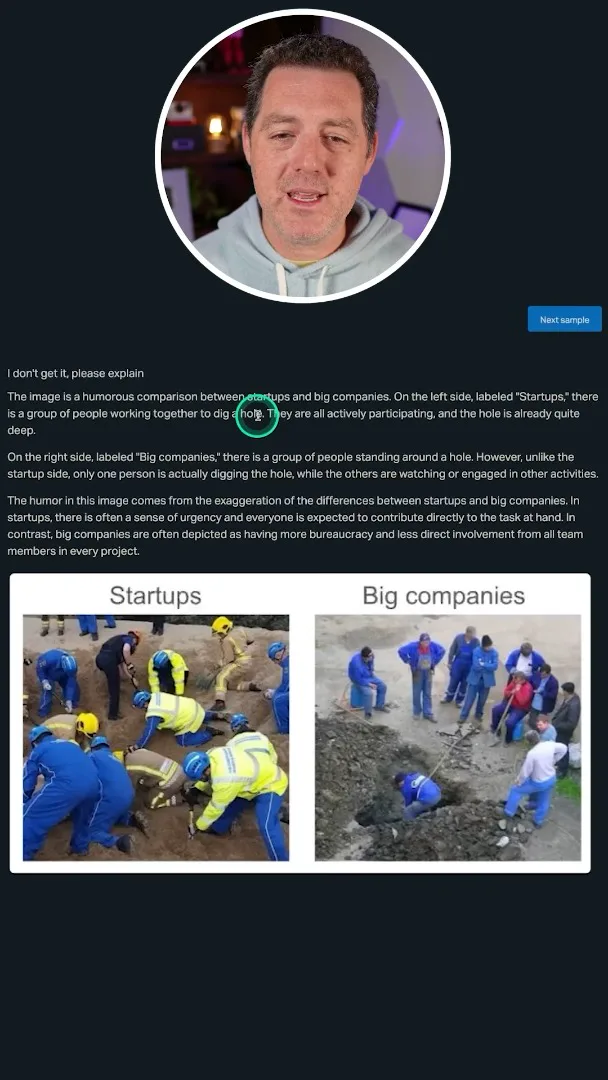
The second example asks Grok to explain a meme. It describes a group labeled startups working together to dig and a group labeled big companies mostly watching one worker, then explains the humor as an exaggerated contrast between the two. I find this example especially impressive, although a single selected image cannot establish general reliability.
同じチャンネルの記事
 25:50EN
 32:20EN
 0:22EN
 45:08EN
 0:32EN
 12:14EN