En 30 secondes
3Blue1Brown explains how a self-similar image can be warped into Escher’s Print Gallery, following an analysis by Bart de Smit and Hendrik Lenstra. The narrator builds the construction through conformal maps, the complex exponential and logarithm, then uses a rotation in log space to close a zoom into a loop.
- 1A picture inside itselfThe Droste effect supplies the nested image that can be joined into a loop.
- 2Escher’s warped gridThe grid distributes a change in scale while keeping small cells approximately square.
- 3Why complex functions preserve local shapeAt a regular point, the complex derivative acts locally as rotation and scaling.
- 4Two directions of repetitionLog space turns scale repetition into horizontal shifts and full rotations into vertical shifts.
- 5Log, rotate, exponentiateThe construction aligns a repeated path with the exponential’s 2π periodicity to close the loop.
À retenir
- A Droste image repeats under a change of scale; Escher’s example uses a factor of 256.
- A conformal map preserves local angles at regular points, even when a whole image is warped.
- The complex exponential maps vertical segments to circles and repeats every 2πi.
- A logarithm unwraps a self-similar image into a doubly periodic pattern.
- Rotating and scaling that pattern before exponentiating turns a zoom into a loop and fills the center with a spiral.
Lire le texte remanié, chapitre par chapitre
A gallery inside a picture
The narrator introduces Escher’s Print Gallery and a self-similar image.
The 3Blue1Brown narrator begins with M. C. Escher’s 1956 lithograph Print Gallery: a viewer in a gallery looks at a harbor scene containing the town and the very gallery in which the viewer stands.
Escher’s work often draws mathematicians to patterns and paradoxes. The narrator follows a 2003 analysis by Bart de Smit and Hendrik Lenstra, showing how a zooming image can become a loop and what might fill the blank center.
First imagine a straight, self-similar image: a person looks at a picture containing a town, a gallery and the same person, continuing inward. This nested-image pattern is called the Droste effect.
In Escher’s case the repeated copy is 256 times smaller. He transformed the nested zoom into a warped loop so that a viewer following the picture around its center moves between scales.
The warped grid
A simpler 16-fold example shows how a mesh distributes zoom around a loop.
The narrator uses a simpler example with a self-similar copy 16 times smaller. To distribute that factor across four corners, each successive corner represents a twofold change in scale: 2 × 2 × 2 × 2 = 16.
One can cut out four progressively zoomed regions and place them around a square. The challenge is to join them smoothly, so that moving around the final image leads back to a matching copy rather than an abrupt seam.
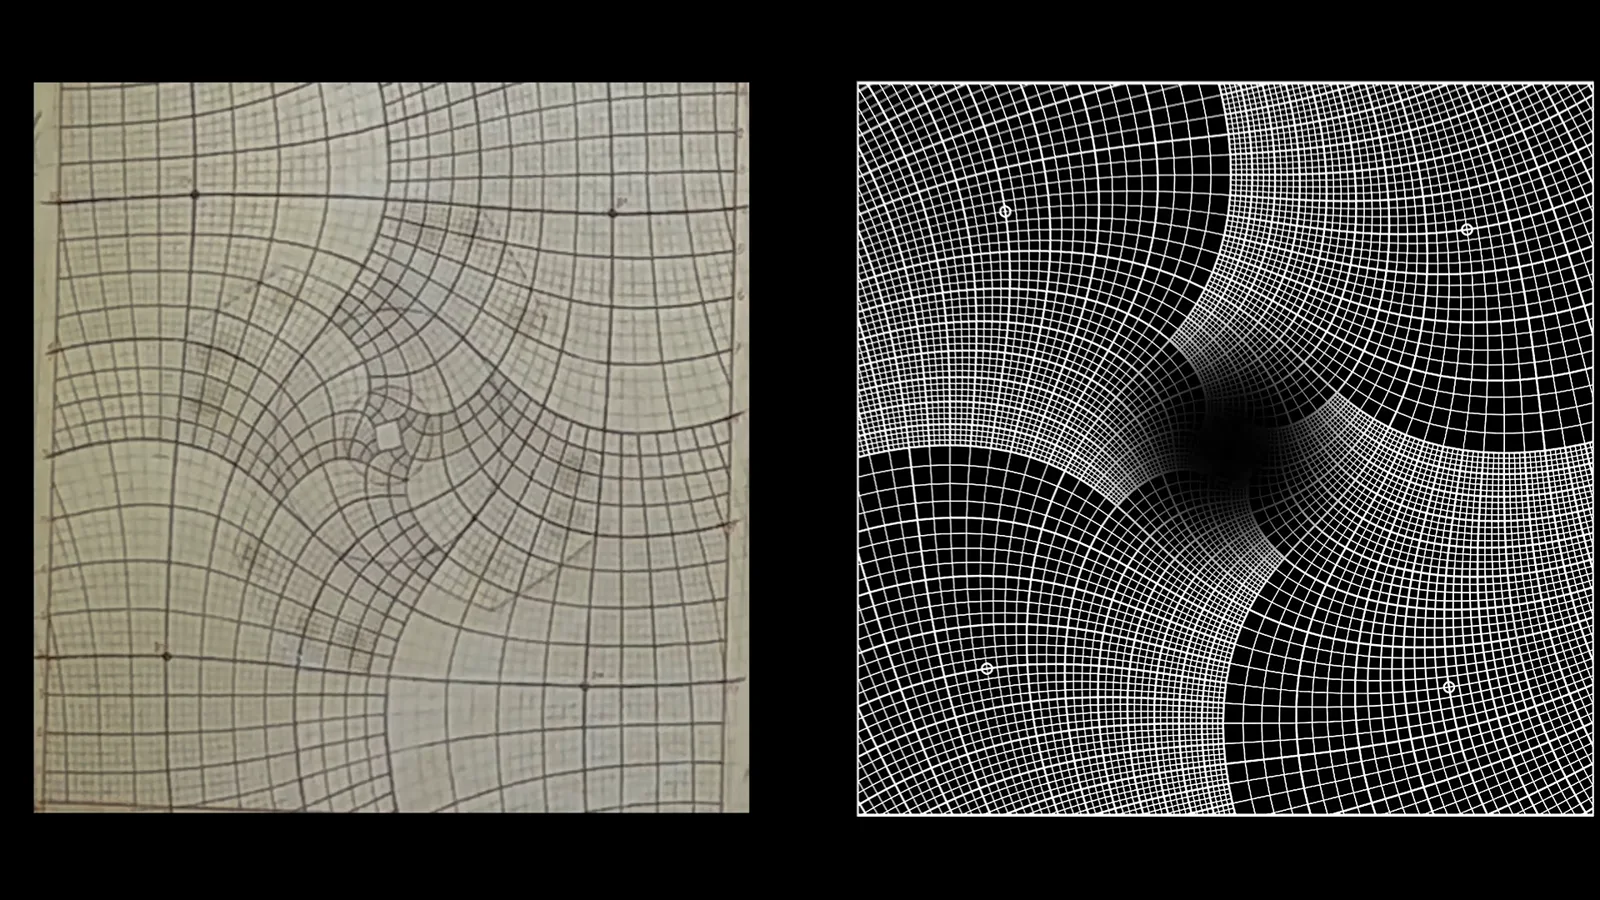
Escher constructed a warped grid. In his 256-fold example, moving from one corner to the next changes scale by four; following the grid lines shows corresponding squares growing by that factor.
To use the grid, lay a square grid over the straight image and copy each small square into its corresponding location on the warped grid. This mesh warp distributes the change in scale across the picture.
The self-similarity is what lets the image close up: after one circuit, the copied region joins a version 16 times smaller in the simplified example. Repeated features such as rows of prints or houses make the cycle easier to perceive.
A naive linear scaling from different directions puts conflicting pressure on grid squares. Escher curved the lines, but also preserved an important local property: sufficiently small cells remain approximately square and their edges meet at right angles.
This means the overall scene can be dramatically warped while local shapes stay recognizable. In mathematics, a transformation that preserves local angles and shapes at regular points is called conformal.
Conformal maps and complex numbers
Complex multiplication and derivatives explain why local shapes can remain recognizable.
The narrator introduces complex numbers as points in a plane. Multiplying by 2 scales the plane; multiplying by i rotates it by 90 degrees. Multiplying by any nonzero complex constant combines scaling and rotation.
More complicated functions warp the grid globally. Under z², for example, small squares away from the critical point at zero become approximately rotated and scaled squares. The approximation improves as the input region shrinks.
This local shape preservation is not typical of an arbitrary two-dimensional transformation, which may squash a small square into a parallelogram. Complex differentiability provides the special structure.
For a real function, differentiability means its graph looks locally linear or, viewed as a transformation, nearby points are approximately scaled by a constant. The derivative describes that local scaling.
For a complex-differentiable function, a tiny neighborhood is approximately transformed by multiplication by the complex derivative. Where that derivative is nonzero, the local effect is rotation and scaling, preserving angles.
The question becomes: can a complex function turn zooming through a self-similar image into a closed loop? The narrator builds the answer from the complex exponential and logarithm.
The exponential and logarithm
The exponential turns vertical lines into circles; the logarithm unwraps the image into a repeating plane.
For e^z, increasing the real part multiplies the output’s distance from zero by e per unit. Increasing the imaginary part moves the output around a circle; a change of 2π completes one turn.
Thus vertical segments of height 2π map to circles, while lines separated by one unit horizontally map to circles with radii differing by a factor of e. The narrator imagines rolling the input plane into a tube and flattening it into concentric rings.
The exponential is many-to-one: 0, 2πi and other inputs differing by integer multiples of 2πi have the same output. This periodicity will be essential to joining the picture into a loop.
The complex logarithm reverses this picture: it unwraps circles into vertical lines. Applied to an image, each output location can be colored by the corresponding point of the original image.
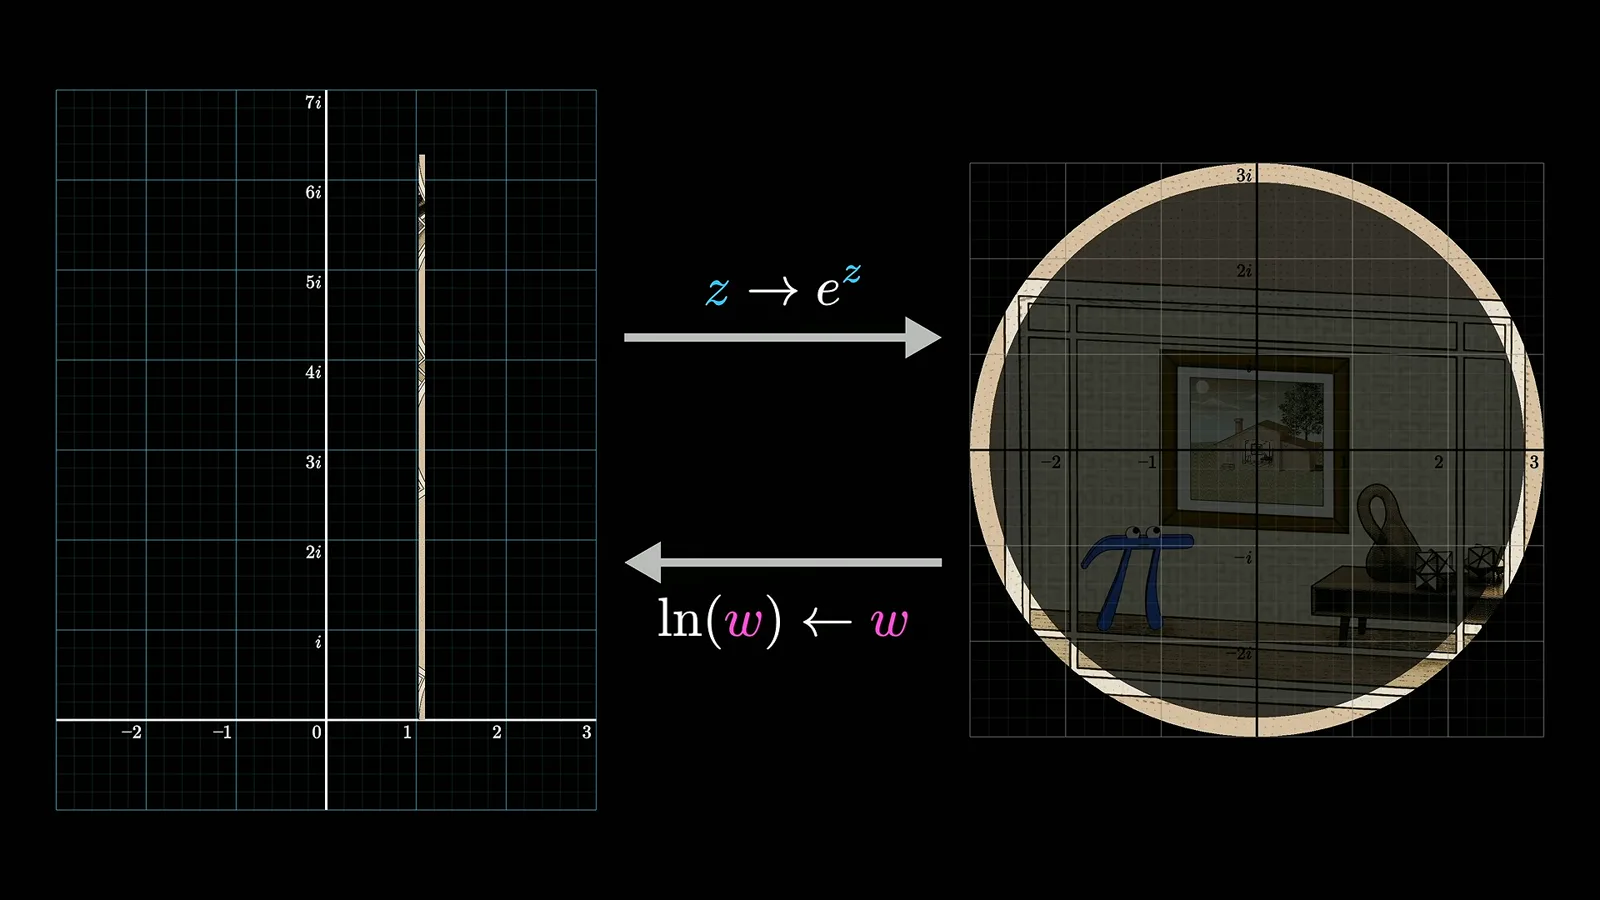
Smaller concentric rings unwrap into lines farther left. Because e^z repeats every 2πi, the unwrapped image can also repeat vertically; points separated by 2πi correspond to the same location in the original image.
The logarithm is naturally multivalued. A branch selects a range of arguments when a single-valued function is needed; here the narrator keeps the repeated copies to visualize the loop.
The second periodic direction comes from the Droste image itself, not from the logarithm alone. Multiplying the image scale by 16 corresponds in log space to a horizontal shift by ln 16.
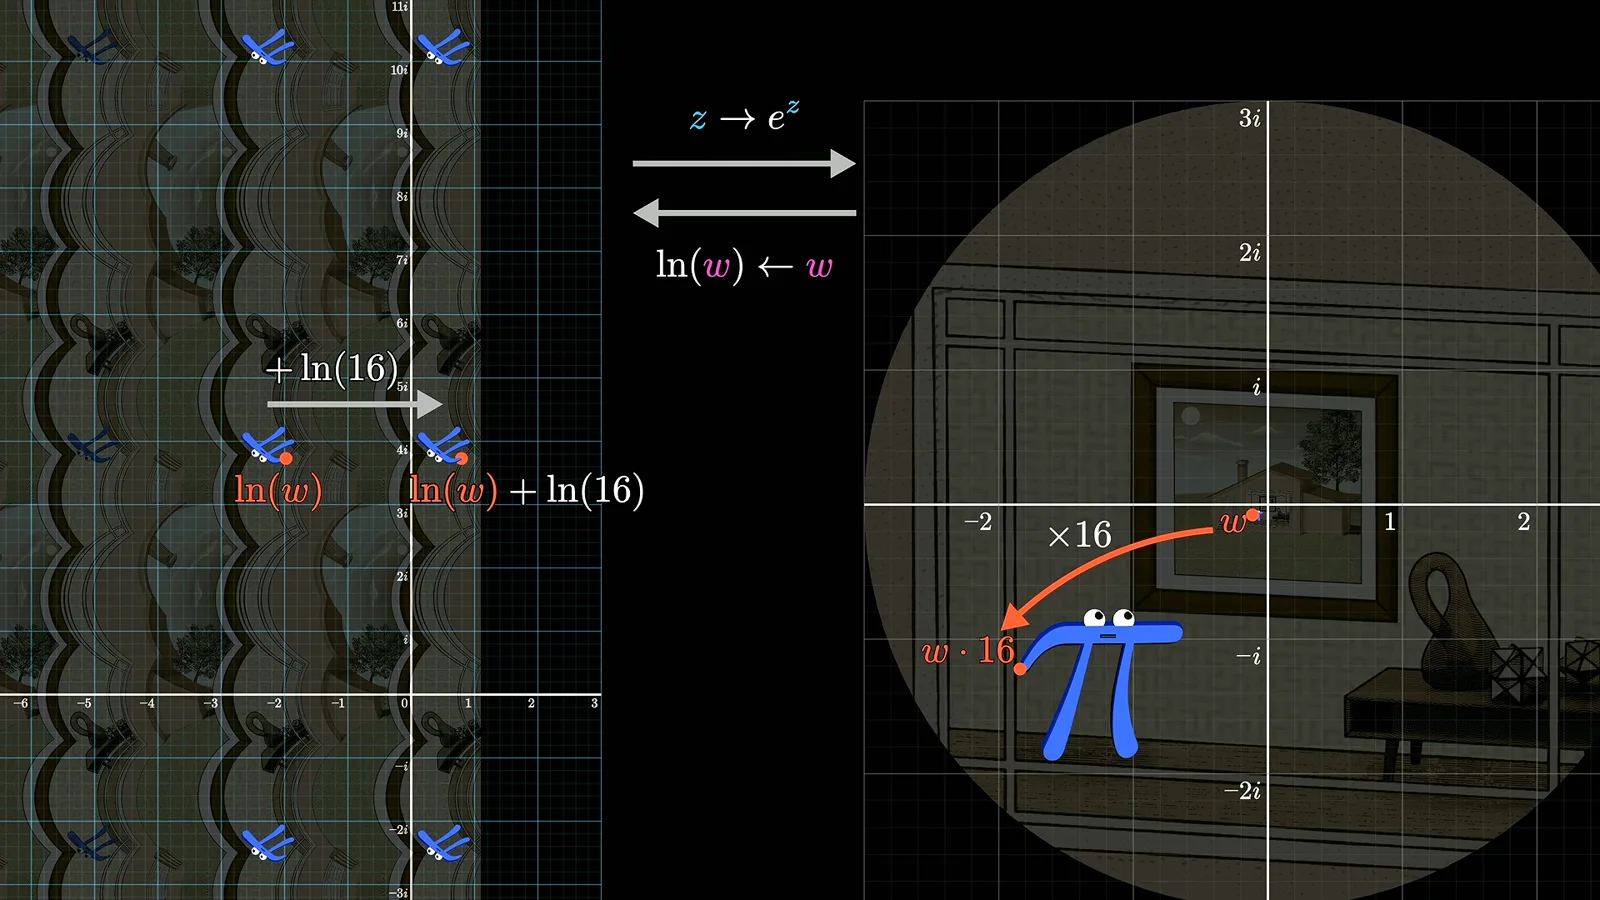
A rectangle of width ln 16 and height 2π contains one repeating tile. Horizontal shifts represent the nested zoom; vertical shifts represent full rotations. The log image is therefore doubly periodic.
Closing the loop in log space
A rotation and scaling align repeated copies before exponentiation, producing the loop and spiral center.
The construction has three stages: take the logarithm, rotate and scale the resulting tiled plane, then apply the exponential. The purpose of the middle step is to turn a path between repeated copies into a vertical segment of length 2π.
The narrator connects the large character to its smaller copy. In log space the copies repeat horizontally and vertically, so he chooses a diagonal path between corresponding copies; its downward component represents a rotation in the original picture.
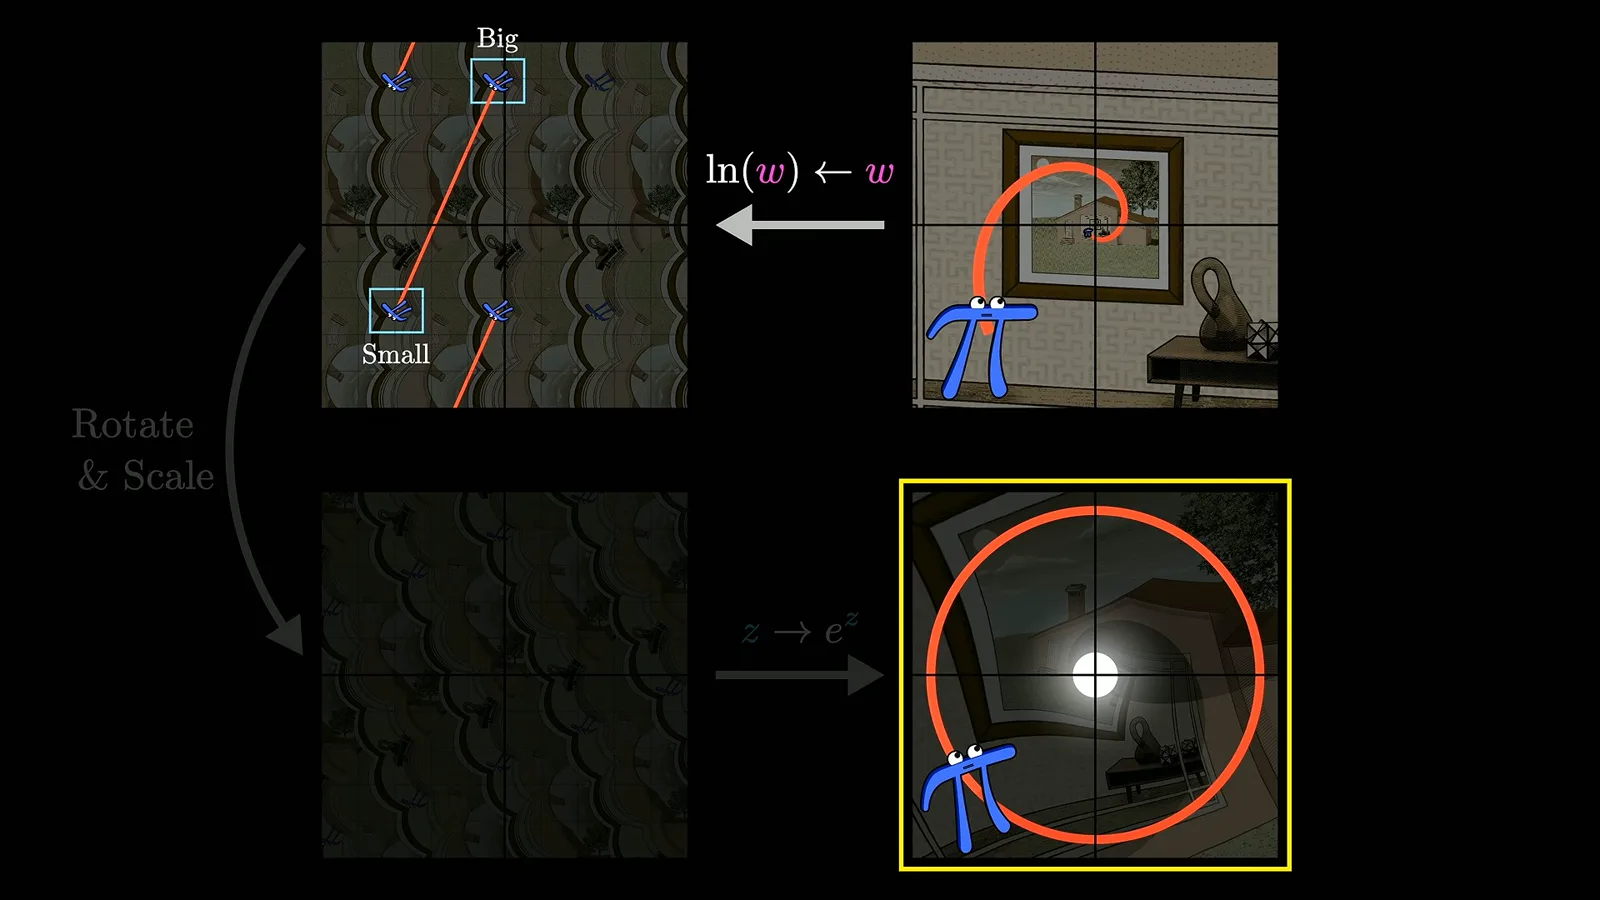
He rotates and scales the log plane so that this diagonal becomes a vertical 2π segment. A complex multiplication supplies the rotation and scale, with an offset to keep a chosen point fixed.
Changing the complex multiplier produces different warped patterns. With the appropriate choice, exponentiation closes the selected path into a circle and recreates the Escher-like loop.
The apparent central hole can be filled by a repeating inward spiral. The construction covers the plane except for the limiting point at zero; zooming continues indefinitely toward that point.
For Escher’s own image, the same method uses a 256-fold self-similarity. The logarithmic tiles are wider, and the rotation and scaling are chosen so a previously diagonal repeat becomes vertical with period 2π.
Exponentiating the transformed plane makes one circuit of the final image correspond to a 256-fold zoom in the original. The resulting center contains a spiraling self-similar image rather than a blank disk.
The composition of a logarithm, multiplication by a complex constant and an exponential can be written compactly as a complex power, with an additional constant for the offset. The compact formula hides the geometric steps that make it understandable.
Using only a horizontal repeat gives a different result: scaling and rotation effectively exchange roles. The diagonal choice is what produces the intended combination of zoom and twist.
The mathematical connection
The warped grid and complex-function construction meet, and doubly periodic patterns lead toward elliptic functions.
The two views—the artist’s warped grid and the logarithmic construction—meet if the same transformation is applied to a scale-repeating grid instead of a picture. The result resembles Escher’s grid and inherits its local conformal behavior.
The narrator emphasizes that no complex analysis is required to enjoy Escher. Mathematics offers another way to appreciate how an aesthetic constraint and the idea of infinity in a finite space produce a visual puzzle.
The doubly periodic pattern also points toward elliptic functions, which play an important role in number theory. De Smit and Lenstra are number theorists; the narrator suggests this background helps explain the mathematical connection they saw.
He closes by comparing the pleasure of Escher’s work with mathematical discovery: both can reveal not only a satisfying solution, but the creativity needed to pose the puzzle in the first place.
Sur la même chaîne
 40:44EN
 3Blue1Brown· 16 oct. 2026Grant Sanderson: There's never been a better time to go into mathGrant Sanderson, Constantin Kogler · 3Blue1BrownStudents fear AI has solved mathematics. Grant Sanderson argues the opposite: even if machines prove theorems better than we do, the institution of math stays valuable—and this is a rare moment when newcomers can reshape it.
 51:55EN3Blue1Brown· 18 sept. 2026The last IMO problem AI could not solveGrant Sanderson · 3Blue1BrownGrant Sanderson walks through IMO 2025 Problem 6 — a tiling puzzle that frontier models missed — and the visual patience it takes to prove a construction is optimal.
 0:55EN3Blue1Brown· 24 juil. 2026The 64 Sugar Cubes Puzzle: Six Equal DistancesA 4×4×4 block has three colors; prove that six same-colored pairs share a distance.
 2:25EN3Blue1Brown· 12 juin 2026How Shannon Measured the Entropy of EnglishA guessing game helped Claude Shannon estimate how much information English text contains, and why prediction is central to compression.
 1:02EN3Blue1Brown· 10 juin 2026A Robot Walk and the Puzzle of Optimal Binary EncodingHow few bits does it take to send directions that occur with unequal frequencies?
 32:19EN3Blue1Brown· 7 juin 2026Reinventing Entropy: Why Prediction Helps Compress LanguageA robot’s movement code leads from prefix-free encoding to Shannon information and the entropy of language.