In 30 seconds
In September 2025, Matthew Berman reviews Anthropic’s Economic Index, focusing on changing Claude usage, geographic concentration and enterprise automation. He is optimistic that AI skills and organizational knowledge can help workers adapt, while acknowledging risks for early-career workers and poorer regions. The research draws on Claude samples and separate surveys, not a census of all AI use; its employment and productivity interpretations are not causal proof. CodeRabbit sponsored the video.
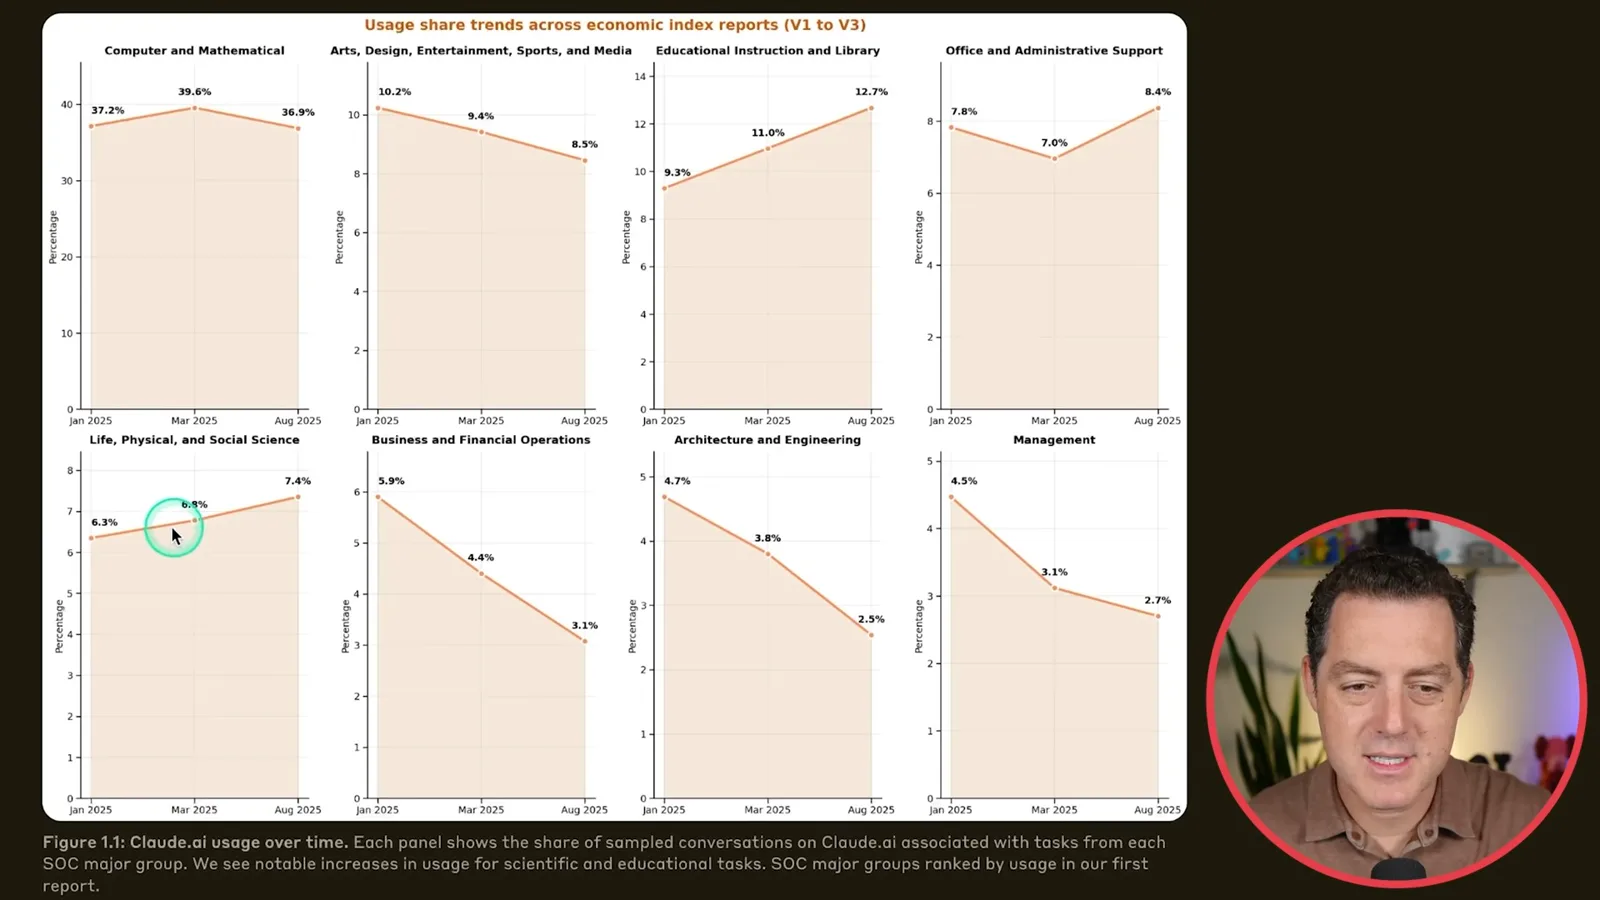
- 1Changing code useThe share of tasks involving new code rose from 4.1% to 8.6%; debugging fell from 16.1% to 13.3% in the report’s samples. This is a change in relative shares, not proof that absolute debugging fell.
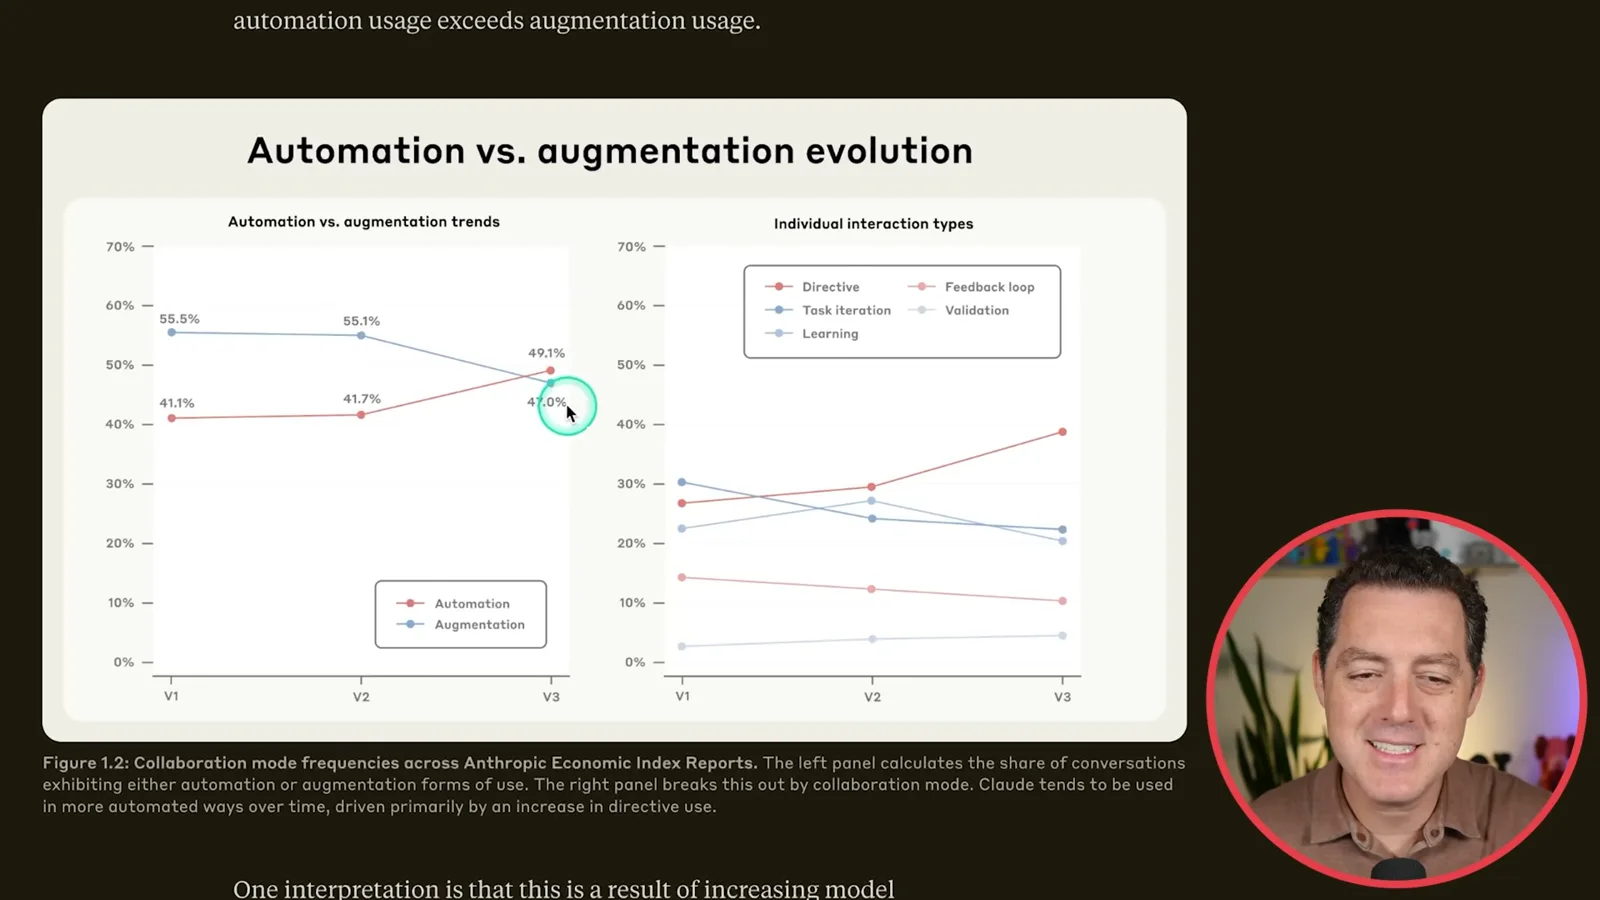
- 2Automation and augmentationAnthropic classifies interaction patterns by whether a task is delegated or developed collaboratively. In its Claude.ai samples the balance shifted toward automation over the period studied.
- 3Early-career uncertaintyBerman cites research showing weaker employment outcomes for young workers in highly exposed occupations. The observed association does not establish AI as the cause.
- 4Uneven geographyIsrael’s Claude usage index was 7 relative to its working-age population share; this measures Claude conversations, not the adoption of all AI tools.
- 5API versus web useIn Anthropic’s sampled API transcripts, 77% showed automation patterns and 12% augmentation. At task-category level, 97% were automation-dominant versus 47% on Claude.ai.
- 6Cost and contextThe report observes a positive raw association between task cost and usage, but a preliminary controlled analysis finds a negative association. Context and organizational data are potential deployment constraints.
Takeaways
- Anthropic’s August 2025 samples indicate that Claude use varied substantially by task and geography, rather than measuring all AI use.
- In sampled Claude.ai conversations, new-code creation gained share while debugging lost share; this does not establish why.
- Israel led Anthropic’s working-age-population-adjusted Claude usage index, while the United States accounted for the largest share of sampled conversations.
- Automation appeared in 77% of sampled first-party API transcripts, compared with 12% showing augmentation patterns.
- The effects on wages, entry-level work and international inequality remain uncertain and depend on more than adoption data.
Read the edited text by chapter
Adoption and changing uses
Berman compares the speed of AI adoption with earlier technologies and reviews shifts in Claude task categories. The figures come from different sources and time periods.
AI is spreading quickly, and a new Anthropic report examines how people use it across jobs, countries and US states. I want to walk through the results and their implications. This video was sponsored by CodeRabbit.
The report cites estimates that 40% of US employees used AI at work, up from 20% in 2023, and compares that adoption with earlier technologies. Electrification took decades to reach rural homes, and personal computers took around 20 years to reach most US homes. Those comparisons involve different populations and definitions, and electricity required a physical last-mile infrastructure buildout.
In Anthropic’s successive Claude.ai samples, the share of tasks involving new code rose from 4.1% to 8.6%, while debugging and error correction declined from 16.1% to 13.3%. The report suggests improved reliability as one possible explanation, but a changing share does not prove the cause or show that the absolute amount of debugging fell.
Computer and mathematical tasks still account for about 36% of sampled usage. Educational and library tasks rose from roughly 9% to 12%, and life, physical and social science tasks from about 6% to 7%; business and financial operations and management lost share. These are shares of the sampled mix, not direct counts of workers in each occupation.
One interpretation is that knowledge synthesis and explanation are spreading quickly: uploading a PDF, asking questions about documents or producing a draft are straightforward uses. The charts show relative trends, so a category can lose share even if its total usage is growing. Architecture and engineering and management lost share, while education gained.
Automation, work and skills
He explains Anthropic’s interaction categories and discusses the possibility of changes to wages and early-career work. CodeRabbit sponsors the video.
Anthropic distinguishes automation, where the interaction centers on task completion, from augmentation, where people collaborate, learn, iterate or validate. Asking Claude to write an essay is a directive interaction; asking it to improve an essay I wrote is more collaborative. The sampled Claude.ai conversations shifted toward automation over the report’s comparison period; this classification does not itself tell us how much human oversight occurs elsewhere.
Sponsor disclosure: CodeRabbit sponsored the video. Berman describes it as an AI code-review tool with review comments, suggested fixes and custom rules, and says it integrates with editors and is free for open-source projects. These are sponsor-read product claims from 2025.
Does increased automation mean widespread job losses? I am optimistic that many jobs will be transformed and believe learning AI tools can help people adapt. Anthropic suggests workers able to adapt to AI workflows could see stronger demand and higher wages, while benefits may be uneven; that is a possibility, not a guaranteed raise for every user.
The report also cites evidence of weaker employment outcomes for early-career workers in highly AI-exposed occupations since late 2022. AI substitution is one possible interpretation, but the correlation does not establish causation. I expect organizations will still need people to prompt, verify and review outputs, though that is my prediction rather than a finding established by the report.
Geography and business adoption
The report contrasts total and population-adjusted Claude use across countries. Berman discusses different request patterns and a separate Census survey of business use.
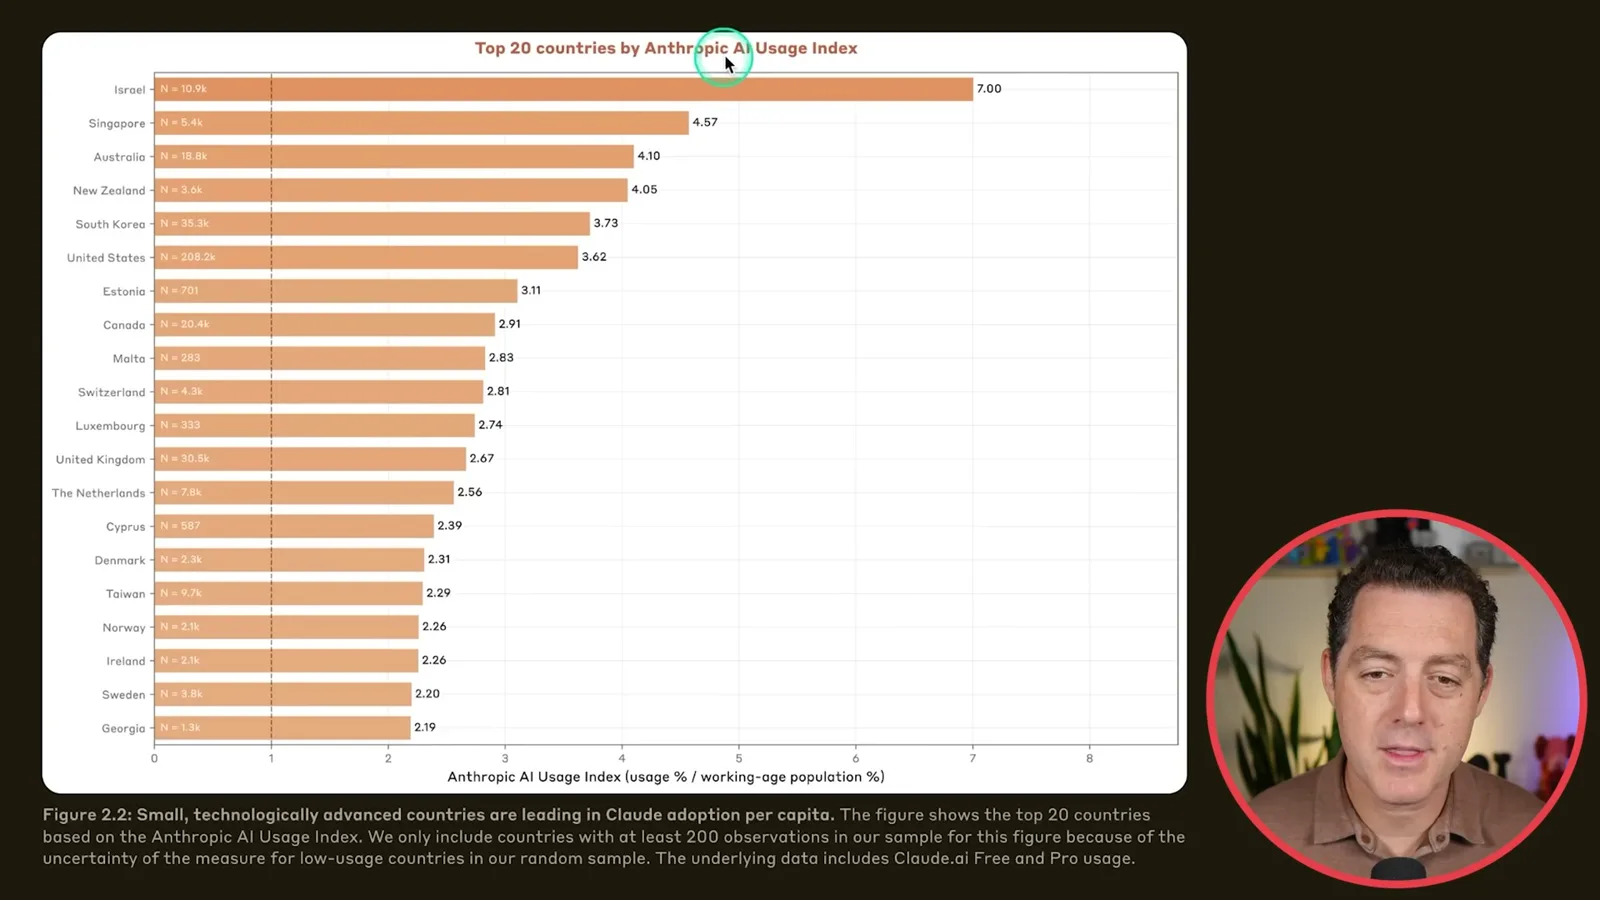
Anthropic compares countries with a usage index: each country’s share of Claude.ai conversations divided by its share of the working-age population. Israel scored 7, followed by Singapore, Australia, New Zealand and South Korea. This is an index of sampled Claude usage relative to population, not a measure of unique users or of all AI adoption.
By total share of the sampled Claude.ai conversations, the US led at 21.6%, followed by India at 7.2% and Brazil at 3.7%. Population size affects these figures. The geographic analysis used one million Free and Pro conversations sampled August 4–11, 2025; it reflects Claude usage, not the entire AI market. [Anthropic’s report](https://www.anthropic.com/research/anthropic-economic-index-september-2025-report) explains the method and its sampling limits.
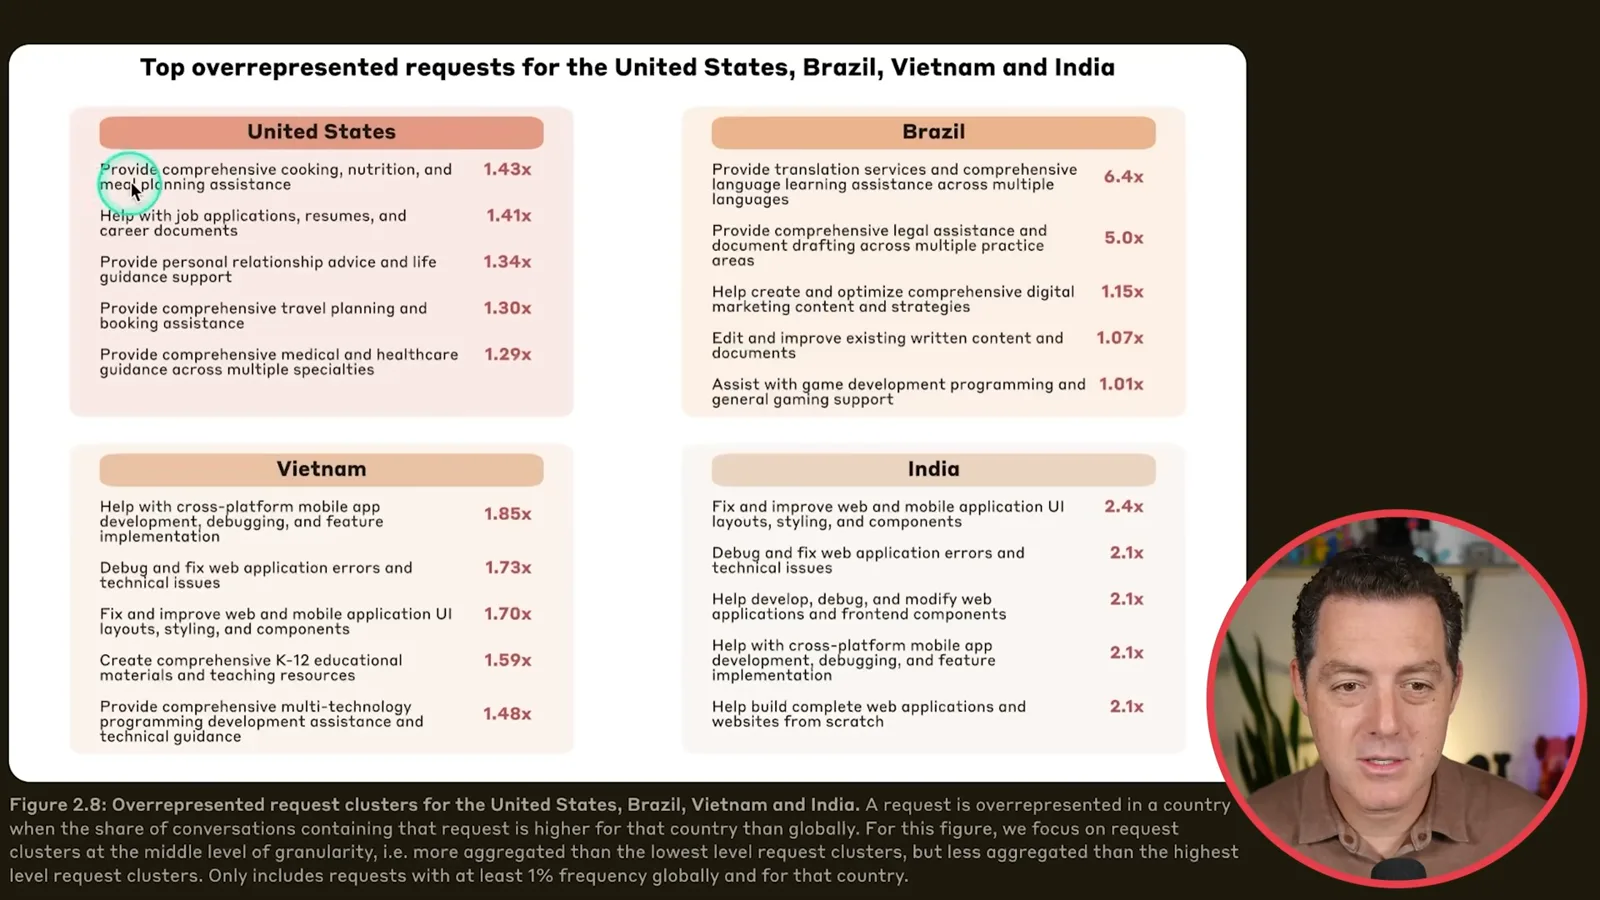
Across countries, the report finds a noisy pattern: lower-adoption markets tend to concentrate more on coding, while higher-adoption markets show a more diverse mix. Its chart of overrepresented requests compares each country with the global mix, not the absolute most common requests. US examples include meal planning and job applications; India and Vietnam show app development, while Brazil shows translation and language learning.
Higher Claude-adoption economies also tended to use it more collaboratively, while lower-adoption economies more often delegated tasks. I find that encouraging for the role of humans in the loop, but this association across markets cannot prove that experience with AI causes a particular style of use.
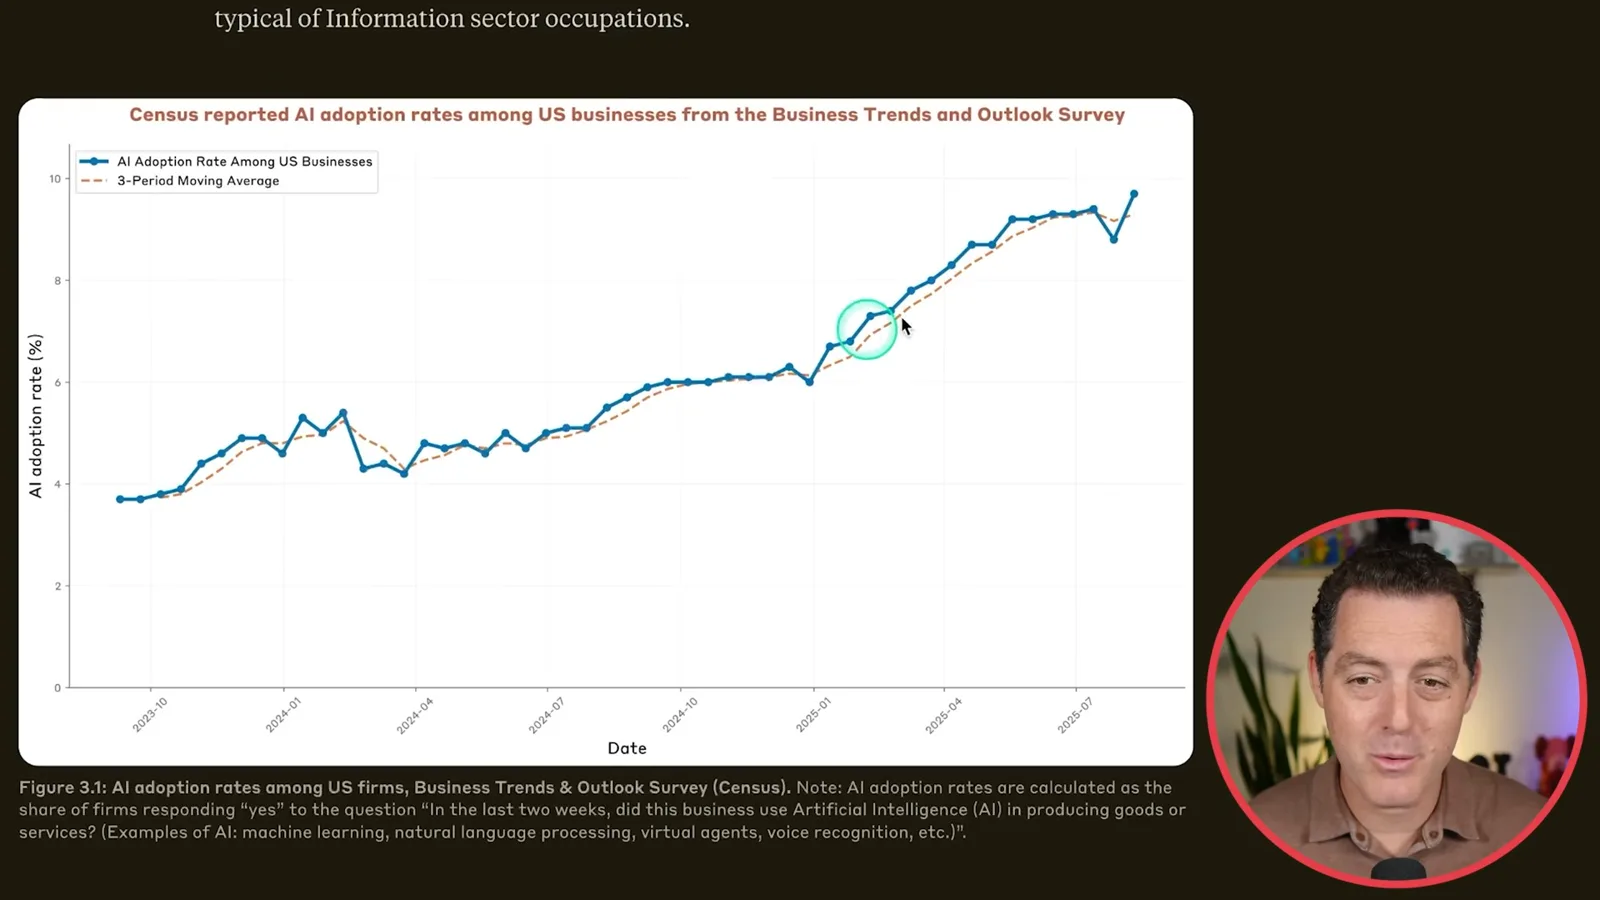
A separate US Census business survey in the report shows adoption rising to nearly 10% overall and about 25% in the information sector at that time. Its question asks whether a business used AI to produce goods or services in the preceding two weeks. It is a different measure from an employee saying they use AI at work, so the figures should not be treated as contradictory.
I see room for people who understand AI to help their organizations implement it, whether as employees or consultants. It can feel as if everyone knows the tools when you spend your time in an AI community, but many businesses have not yet integrated them into their production processes.
Enterprise API use and economic implications
Anthropic reports distinct API and Claude.ai interaction patterns, explores cost and context, and raises the possibility of unequal economic gains. Berman closes with a demonstration of the geographic dashboard.
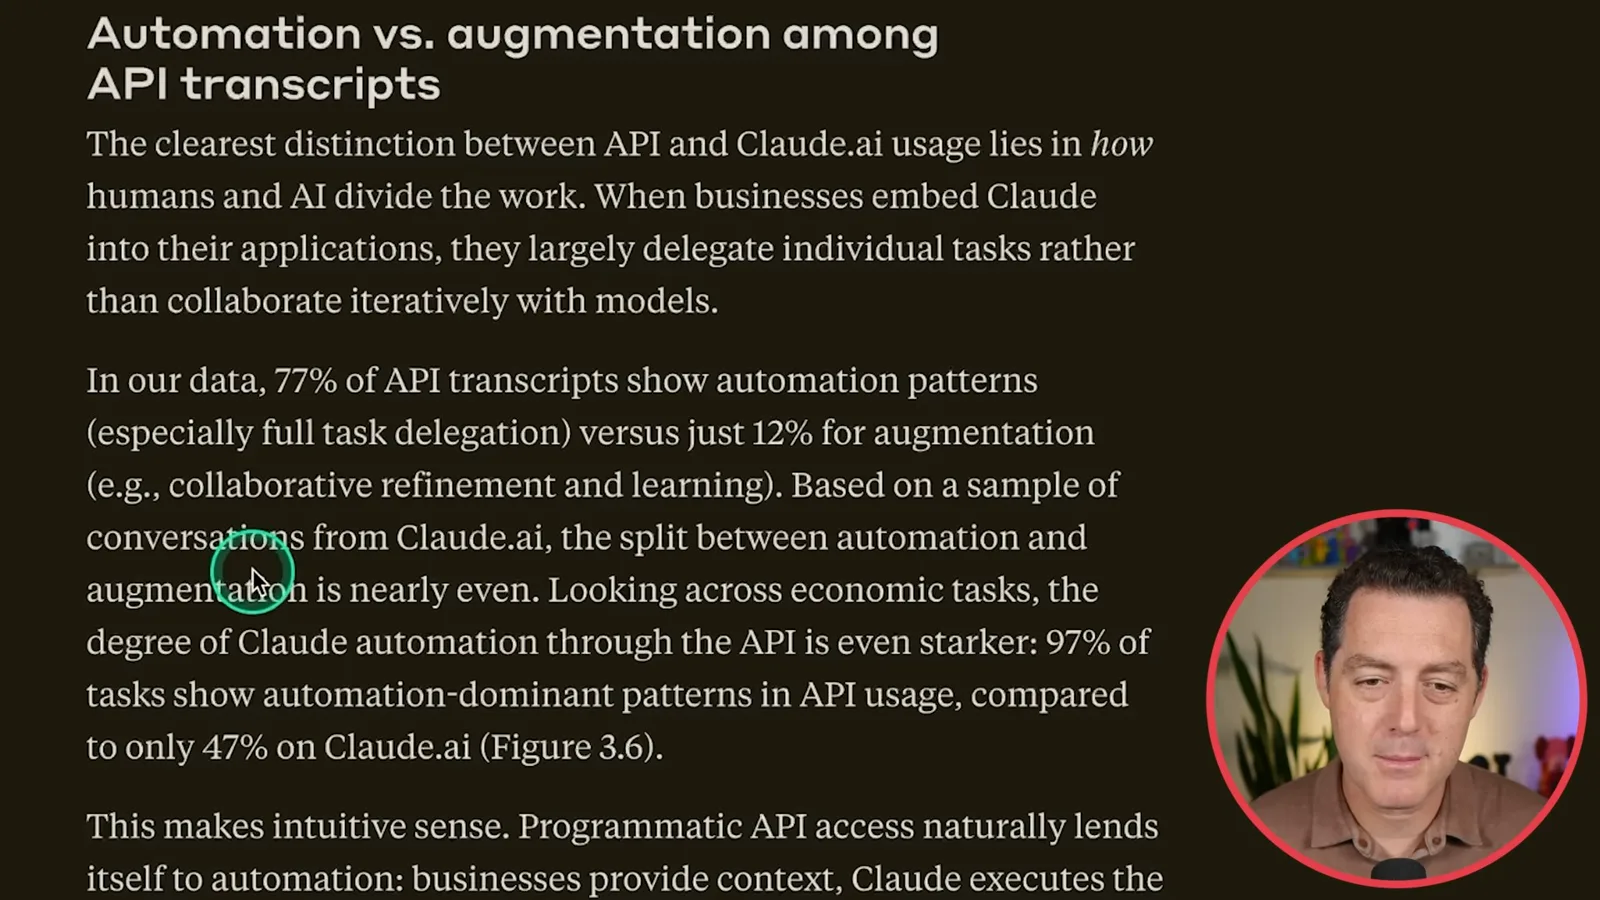
Anthropic’s August 2025 sample of first-party API transcripts showed automation patterns in 77% and augmentation in 12%; Claude.ai conversations were nearly evenly split. Looking across task categories instead of transcripts, 97% of API task categories were automation-dominant versus 47% on Claude.ai. These different denominators do not mean 97% of jobs are automated.
The report finds that more expensive API tasks also tended to be more common in the raw data, which I interpret as businesses prioritizing useful results. But cost is not proven irrelevant: its preliminary analysis controlling for task characteristics found a negative association between cost and usage. These observations are not a causal test of price changes or proof of Jevons paradox.
Another bottleneck is context: useful deployment can require firms to organize scattered, unstructured information and make it available to a model. Anthropic suggests data modernization and organizational investment may be costly barriers. I see this as a reason for the shift in emphasis from writing prompts to assembling the right context.
The report warns that if productivity gains are larger in high-adoption economies, the benefits could concentrate in already rich regions and widen international inequality. This is a risk, not an observed conclusion that AI has already caused divergence; future effects depend on actual productivity gains and policy choices.
Anthropic also suggests that experienced workers with tacit organizational knowledge could gain demand and wages even as entry-level workers face weaker prospects. I think this raises a practical question: how can people acquire that knowledge if they struggle to get their first job? My guess is that AI skills can help them enter and then learn the organization, but that remains a hypothesis.
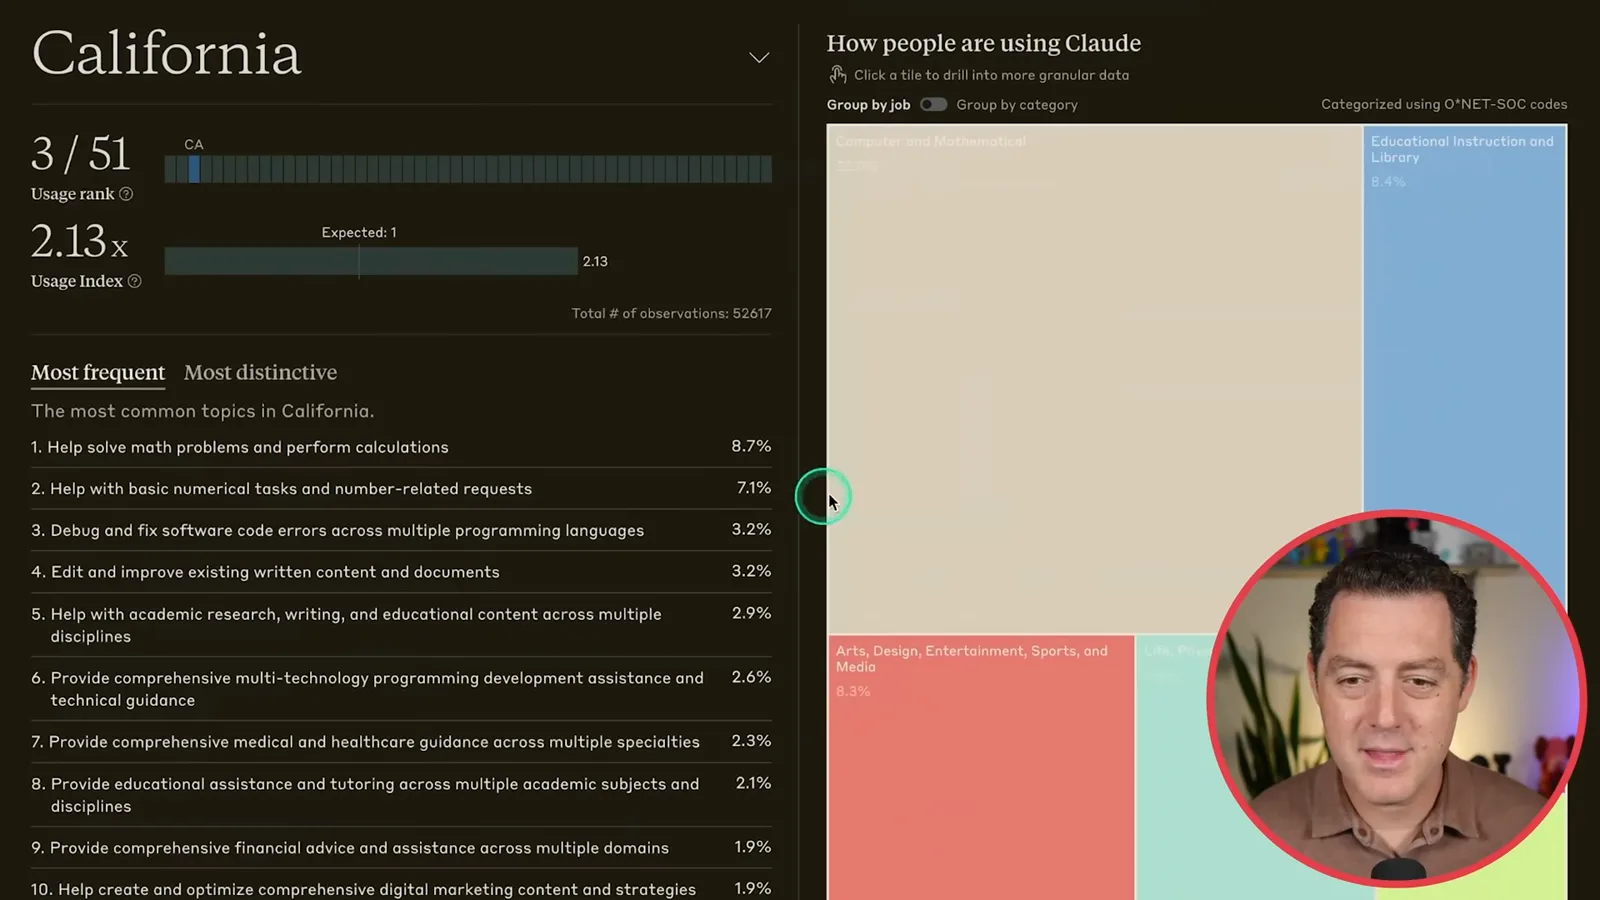
Policy will matter alongside technical capabilities in shaping the economic outcome. The report includes an interactive dashboard: I select California to inspect its usage index, rank, job categories and frequent requests, with similar breakdowns available for other states and countries.
More from this channel
 34:21EN
 Matthew Berman· Oct 27, 2026Matthew Berman Examines Anthropic’s IPO Filing, AI Growth and GovernanceMatthew Berman, Sam Altman · Forward FutureThe presenter reviews the S-1’s financial metrics, compute strategy and voting structure while questioning the tension between rapid AI development and safety.
 0:26ENMatthew Berman· Oct 25, 2026Sam Altman on Human Values and Problem-Solving in an AI WorldSam Altman · OpenAIIn a short interview excerpt, Altman considers the enjoyment of solving hard problems and the human role in interpreting results.
 0:36ENMatthew Berman· Oct 25, 2026Kimi K3.1 and a Rubik’s Cube Solver DemonstrationMatthew Berman · Forward FutureMatthew Berman shows a scrambled virtual cube being solved and gives the Kimi K3.1 test a favorable assessment.
 0:21ENMatthew Berman· Oct 24, 2026An AI-Generated Kimi Benchmark Chart Used Invented ScoresMatthew Berman · Forward FutureMatthew Berman asks for a graph of Kimi K3.1 Pro benchmarks, then discovers that the displayed figures are illustrative placeholders.
 25:50ENMatthew Berman· Oct 24, 2026Kimi K3.1 Pro Tested: Strong 3D Demos, Uneven Results and Competitive PricingMatthew Berman · Forward FutureMatthew Berman tests the open-weight model on coding, 3D rendering and visual explanations, then compares benchmark results and prices.
 32:20ENMatthew Berman· Oct 23, 2026Who Is Local AI For? The Costs, Trade-offs and a Hybrid FutureMatthew Berman · Forward FutureMatthew Berman weighs data control and independence against hardware cost, setup complexity and inference speed.