30초 요약
At a Citadel Securities event, technology COO Jeff Maurone describes the firm’s approach to using AI, analytics and compute to anticipate institutional clients’ market questions. He presents selected examples and company claims, followed by a short company video about trading and risk infrastructure. Market figures, model performance and future scenarios are the presenters’ claims and are not independently verified here.
- 1From a bottleneck to precomputationMaurone uses protein-structure prediction as an analogy for using compute to answer questions in advance.
- 2Breakout probabilityHe describes a model combining retail and options flows with short interest, using a selected Avis example.
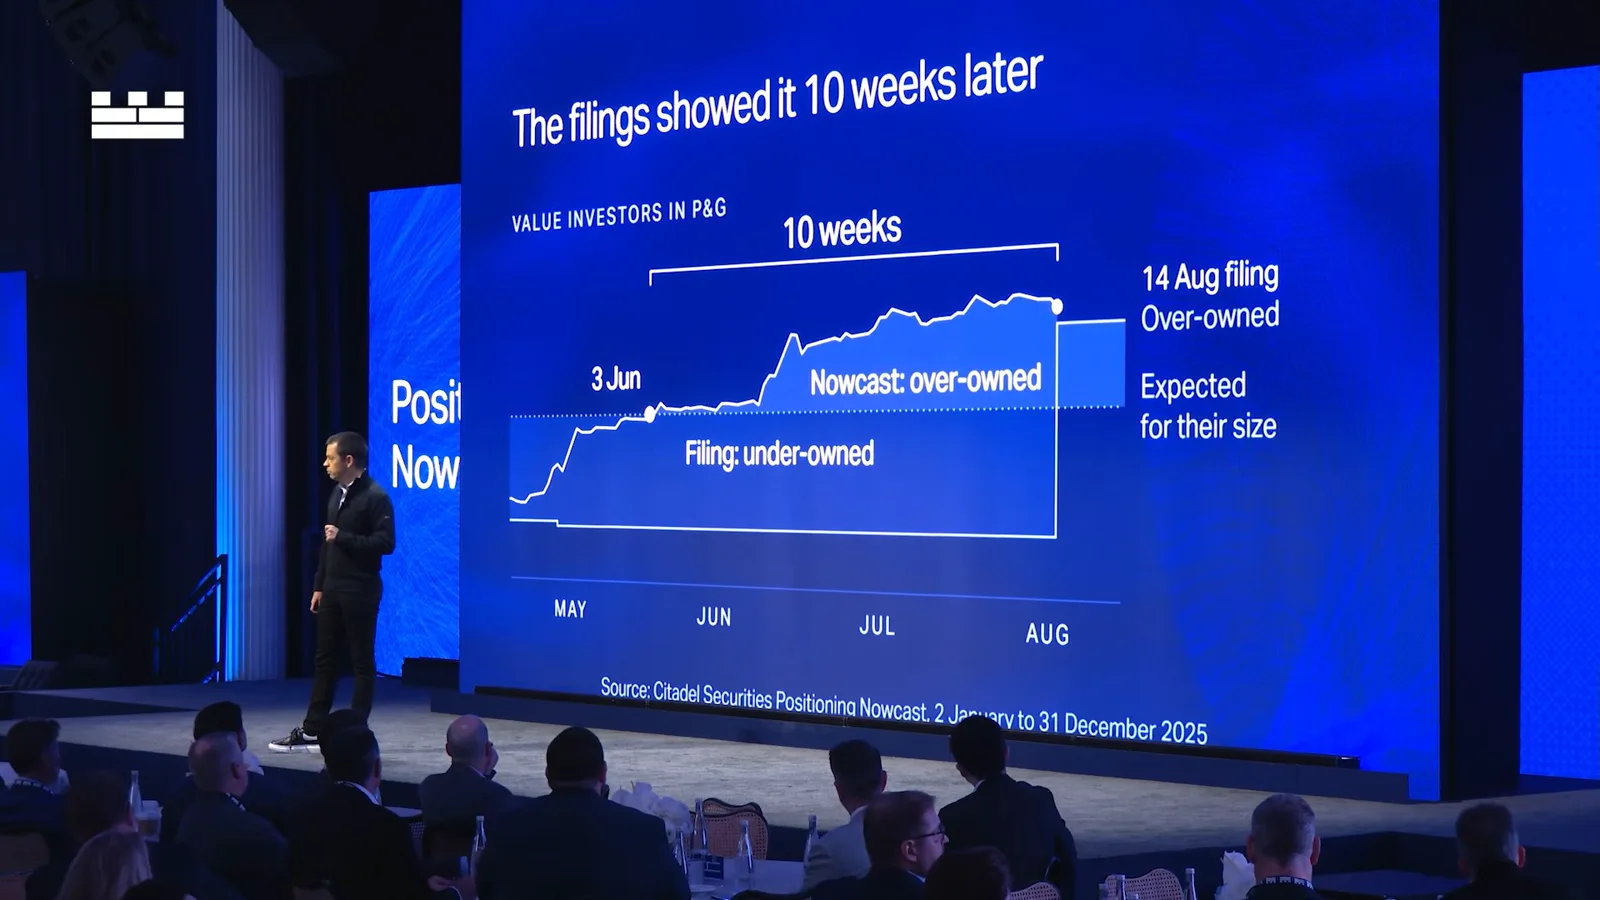
- 3Positioning nowcastHe contrasts quarterly filings with an estimated daily view, illustrating it with Procter & Gamble.
- 4Credit-market heat mapThe presentation shows an illustrative map of issuer trading volume and spread changes.
- 5An IPO scenarioMaurone discusses a SpaceX IPO analysis and the firm’s assumptions about institutional and retail capacity.
- 6Research infrastructureHe describes the firm’s quantitative platform, data resources and technical workforce.
핵심 정리
- Maurone argues that AI can expand an analyst’s initial question into broader, precomputed analysis.
- His examples include estimates of short-squeeze risk, equity positioning and investment-grade credit spreads.
- The examples are selected company illustrations; they do not establish predictive accuracy or future investment outcomes.
- A company video describes fractional trading, extended hours and scenario-based risk management.
- Maurone says the firm’s tools rest on a quantitative-research platform, data and substantial computing resources.
챕터별로 다듬은 전문 읽기
Amplifying questions with computation
Maurone uses protein-structure prediction as an analogy for moving from individual requests to precomputation. He describes how he applies that idea to market questions.
I am Jeff Maurone, technology COO at Citadel Securities. To introduce how the firm approaches computation, I begin with protein-structure research and the work of Demis Hassabis and the DeepMind team. I use the example to illustrate how machine learning can change a bottleneck and how large-scale computation can expand the questions researchers address.
I describe a shift from processing individual structure-prediction requests toward predicting structures at scale, including a database covering more than 200 million proteins. These are computational predictions, not a claim that every structure was experimentally verified. The analogy I draw is moving from answering each question when asked to preparing a broader set of answers in advance.
In companies, I argue, the value of AI is not limited to operational savings. An analyst can begin with an intuition about what might move a market and use computation to expand the analysis. I contrast reading a few 13F filings with a possible system that processes many filings, compares history and models portfolio exposures.
The examples that follow are selected illustrations of Citadel Securities’ tools and analysis. I present them as ways to prepare for clients’ questions, but the examples and figures in this talk do not independently establish a model’s predictive accuracy or guarantee future outcomes.
Short squeezes and positioning
He presents selected examples of short-squeeze probability and estimated positioning changes. The examples are company illustrations rather than independently validated forecasts.
The first question is how to anticipate a short squeeze. I describe a tool called Breakout Probability that combines retail equity and options flows with institutional short-interest information. The firm computes an estimate for securities on a recurring basis, according to my presentation.
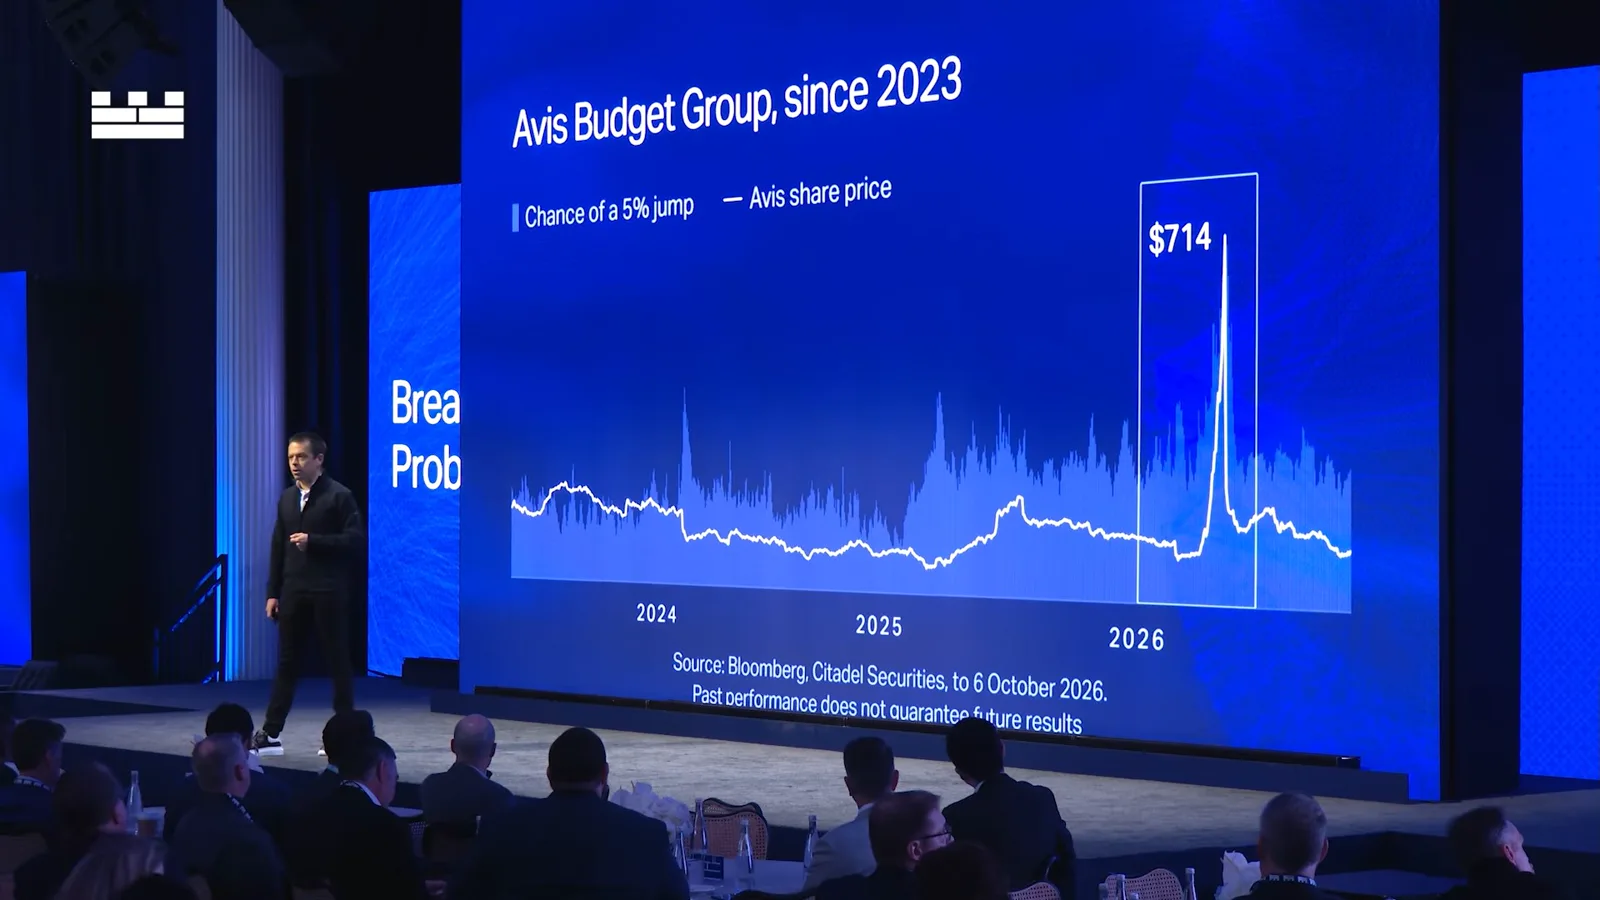
I show an Avis example and say the tool indicated elevated risk before a large price move. This is a selected historical case presented by the firm; a displayed signal in one case does not show how often predictions are right or wrong. The slide labels its measure as the chance of a 5% jump.
The second question concerns positioning: who holds a stock and what may have changed? I note that 13F filings are quarterly and delayed, then describe a Positioning Nowcast that combines a filing-based starting point with market-flow information to estimate changes more frequently.
In a Procter & Gamble illustration, I compare the nowcast with a later filing and say the estimated shift in value-investor positioning appeared about ten weeks earlier. This is the presenter’s comparison for the example shown; an estimated position is not the same as a directly observed portfolio.
Credit spreads and an IPO scenario
The presentation turns to an investment-grade credit heat map and an analysis concerning SpaceX. Figures and assumptions are attributed to the presenter.
Next I discuss investment-grade corporate bonds. I say the large number of securities, uneven liquidity and multiple venues make issuer-level spread changes difficult to see systematically. The firm combines pricing information and estimates to create a view of spreads by security and issuer.
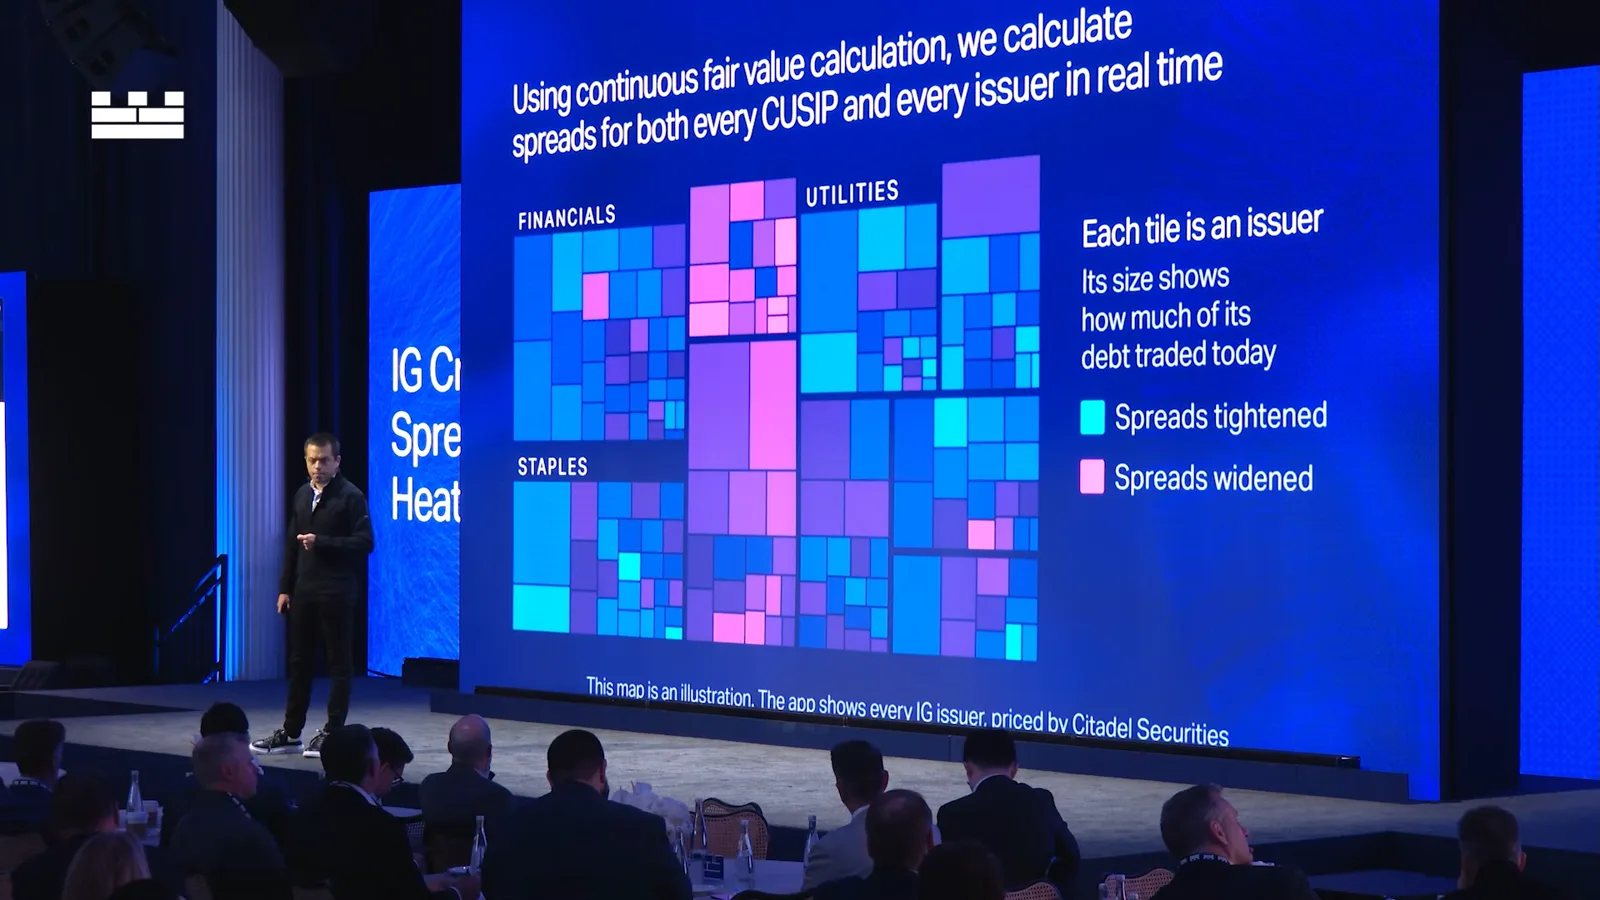
The illustrative heat map uses tile size for trading volume and color for whether spreads tightened or widened. I say the firm moved from sending static images to an interactive view that clients can filter by sector and historical date. The image is an illustration of the interface, not proof of a trade or recommendation.
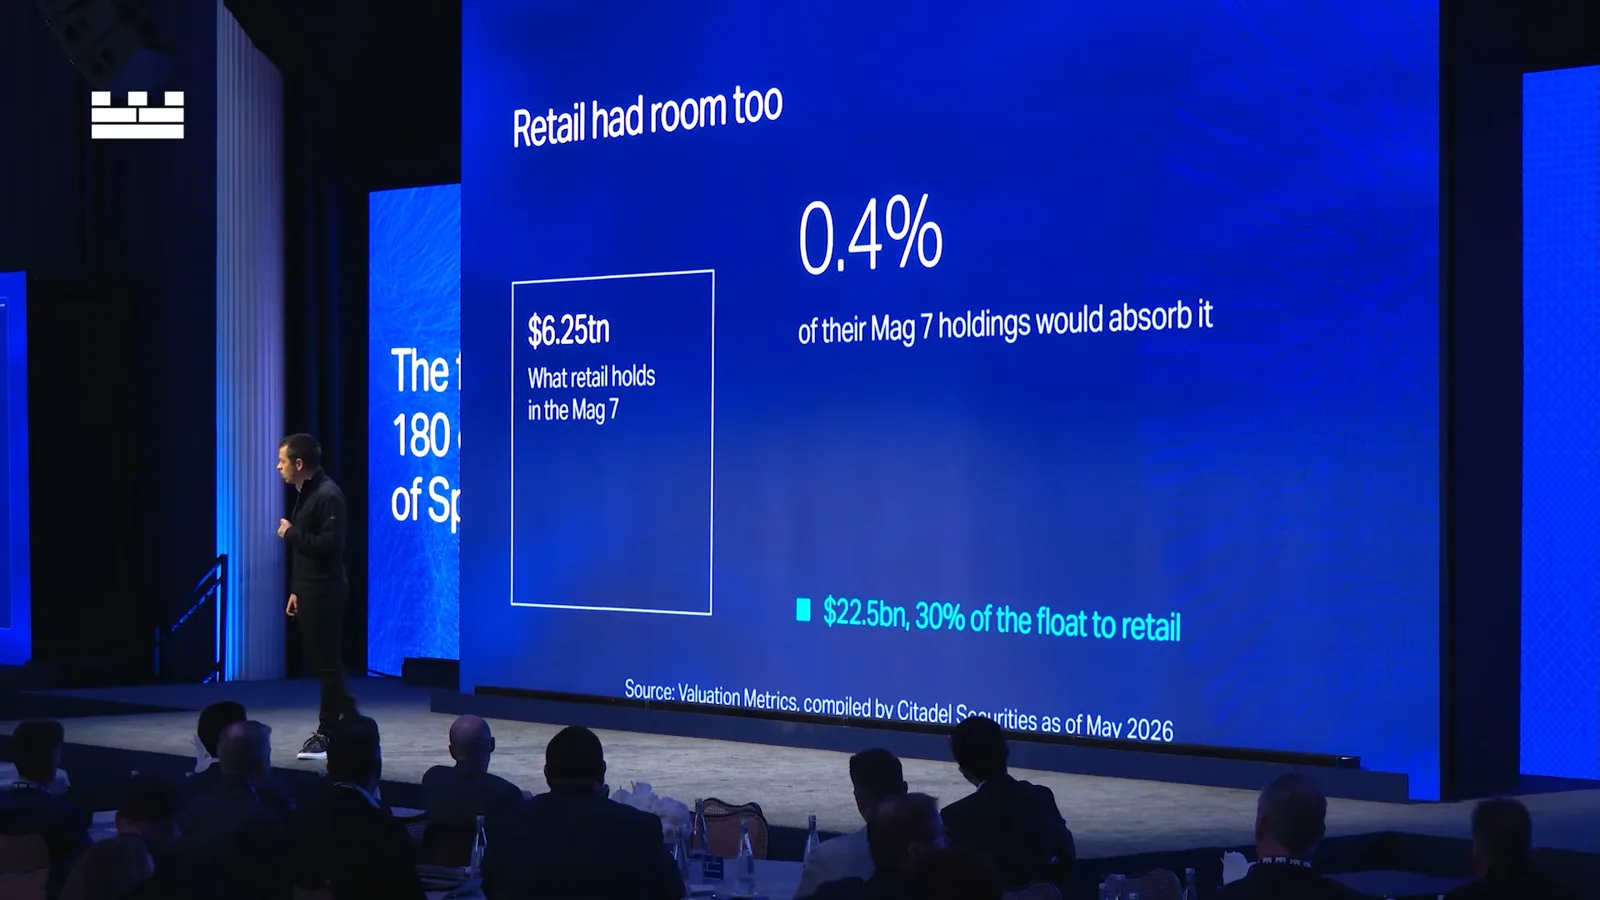
I then describe client questions about a SpaceX IPO and whether institutional and retail demand could absorb the available float. The following figures are the firm’s scenario analysis as presented at the event; the discussion does not independently verify the underlying assumptions or offer a prediction about a particular security.
For institutions, I say the largest holders of major technology stocks could cover the institutional allocation by selling less than 1% of those holdings. For retail, the slide cites $6.25 trillion in holdings of the seven major technology companies and estimates that 0.4% could cover the stated retail allocation. These are calculations from the presentation, not evidence those investors would actually sell or buy.
I discuss lockup expirations and compare more than 400 historical events, saying prices typically fell into expiry while retail remained a source of liquidity. This is a historical characterization from the firm; patterns in a selected sample do not guarantee behavior in a later offering.
Trading and risk infrastructure
A company video describes retail trading, fractional orders, extended hours and scenario analysis. Maurone then discusses work with clients’ technology teams.
A prerecorded company video describes Trade Seeker, which it says combines proprietary retail equity and options information with third-party data. The speaker says clients can access the insights through a digital platform. This is the company’s description of its product.
Another speaker in the company video discusses fractional and notional orders and extended trading hours. The speaker says the firm handles a broad range of order sizes and supports trading across a 24-hour, five-day schedule. These are operational claims made in the company presentation.
A third company-video speaker describes a risk center and the use of scenario analysis and stress testing. The stated aim is to support execution for clients in both calm and volatile markets. The video presents the firm’s intended approach rather than a complete independent assessment of its risk controls.
Returning to the stage, I say the firm has spent time with more than 100 client technology teams discussing agent construction, quantitative research and trading platforms. Examples include secure sandboxes, organizing data for models and simplifying the infrastructure used by trading teams.
I say the tools shown are live products rather than conference-only demonstrations, and that some are used by hundreds of clients. This is a company assertion. I then turn to the internal technology foundation that supports the services.
The research foundation
Maurone describes the firm’s research platform, data scale and workforce. He closes by inviting clients to work with the firm on market questions.
I describe a quantitative research platform called Ozeki and say more than 500 quantitative researchers use it. I report a research dataset exceeding 200 petabytes and a research workforce that includes more than 300 PhDs. These scale figures are company-reported at the time of the event.
I also say the firm sees a substantial portion of retail orders before public-market execution and that 65% of colleagues write code. I attribute the firm’s trading software, increasingly its hardware, and operational resilience to that technical foundation. These are claims about the firm’s own business.
I close by returning to the opening idea: human intuition supplies a starting question, and computing and analytics can expand the analysis. I argue that collaboration with clients can improve which questions the firm chooses to investigate.
같은 채널의 다른 글
 1:01:02EN
 Citadel Securities· 2026년 10월 27일팟캐스트 · 3명Sequoia's Alfred Lin and Konstantine Buhler on AI, Investment and the Agent Economy게스트 Alfred Lin, Konstantine Buhler · 진행자 Nohshad ShahAt Citadel Securities' 2026 conference, the partners discuss their investment process, model competition, computing constraints and future opportunities.
 45:34ENCitadel Securities· 2026년 10월 26일팟캐스트 · 2명Henry Paulson on AI Risk, U.S.–China Relations and Crisis Leadership게스트 Henry M. Paulson, Jr. · 진행자 Jim EspositoThe former Treasury secretary discusses today’s economic risks and lessons from the 2008 financial crisis.
 1:01:23ENCitadel Securities팟캐스트Jensen Huang on AI Factories, Digital Workers and Why the Build-Out Has Barely BegunNvidia's CEO tells a room of institutional investors how accelerated computing led to AI factories, and where agentic AI, robotics and sovereign AI go next.