30 秒でわかる
In this Real Numbers episode, Sawyer solves a marching-band probability problem with indicator variables, first for independent starting feet and then for an exactly balanced split. The episode closes with an open challenge to find the expected number of snowboards used over six lessons.
- 1Turn a count into indicatorsWrite the number of in-step rows as the sum of ten 0-or-1 variables.
- 2Independent startersEach row is in step with probability 1/8, giving an expected count of 5/4.
- 3Exactly balanced startersSampling without replacement gives a per-row probability of 51/481 and a total expectation of 510/481.
- 4Dependence does not break linearityThe rows affect one another, but their expected values still add.
ポイント
- An indicator variable has expected value equal to the probability of the event it indicates.
- The expected number of in-step rows is 5/4 when each player independently chooses a foot.
- With exactly 20 starters on each foot, the expected number of in-step rows is 510/481.
- Linearity of expectation applies even when indicator variables are dependent.
- The snowboard problem can be approached with one indicator per board.
チャプターごとに整えた全文を読む
The snowboard question
Sawyer poses a new expected-value problem about six lessons and six boards. A board is sharpened if it was used at least once.
Welcome to Real Numbers, where we solve problems and discover mathematics along the way. This week’s question continues our exploration of expected value with a snowboarding instructor.
Rachel teaches a private lesson six days a week. Each day her student chooses one of her six snowboards uniformly at random. At the end of the week she sharpens every board used at least once. On average, how many boards does she need to sharpen?
Independent marching-band rows
Indicator variables and linearity of expectation yield an average of 1.25 in-step rows when each marcher independently chooses a starting foot.
Before tackling that problem, let us solve the previous episode’s marching-band question. Forty members are arranged in ten rows of four. Each independently starts with the left or right foot, each with probability one half. We want the expected number of rows in which everyone starts on the same foot.
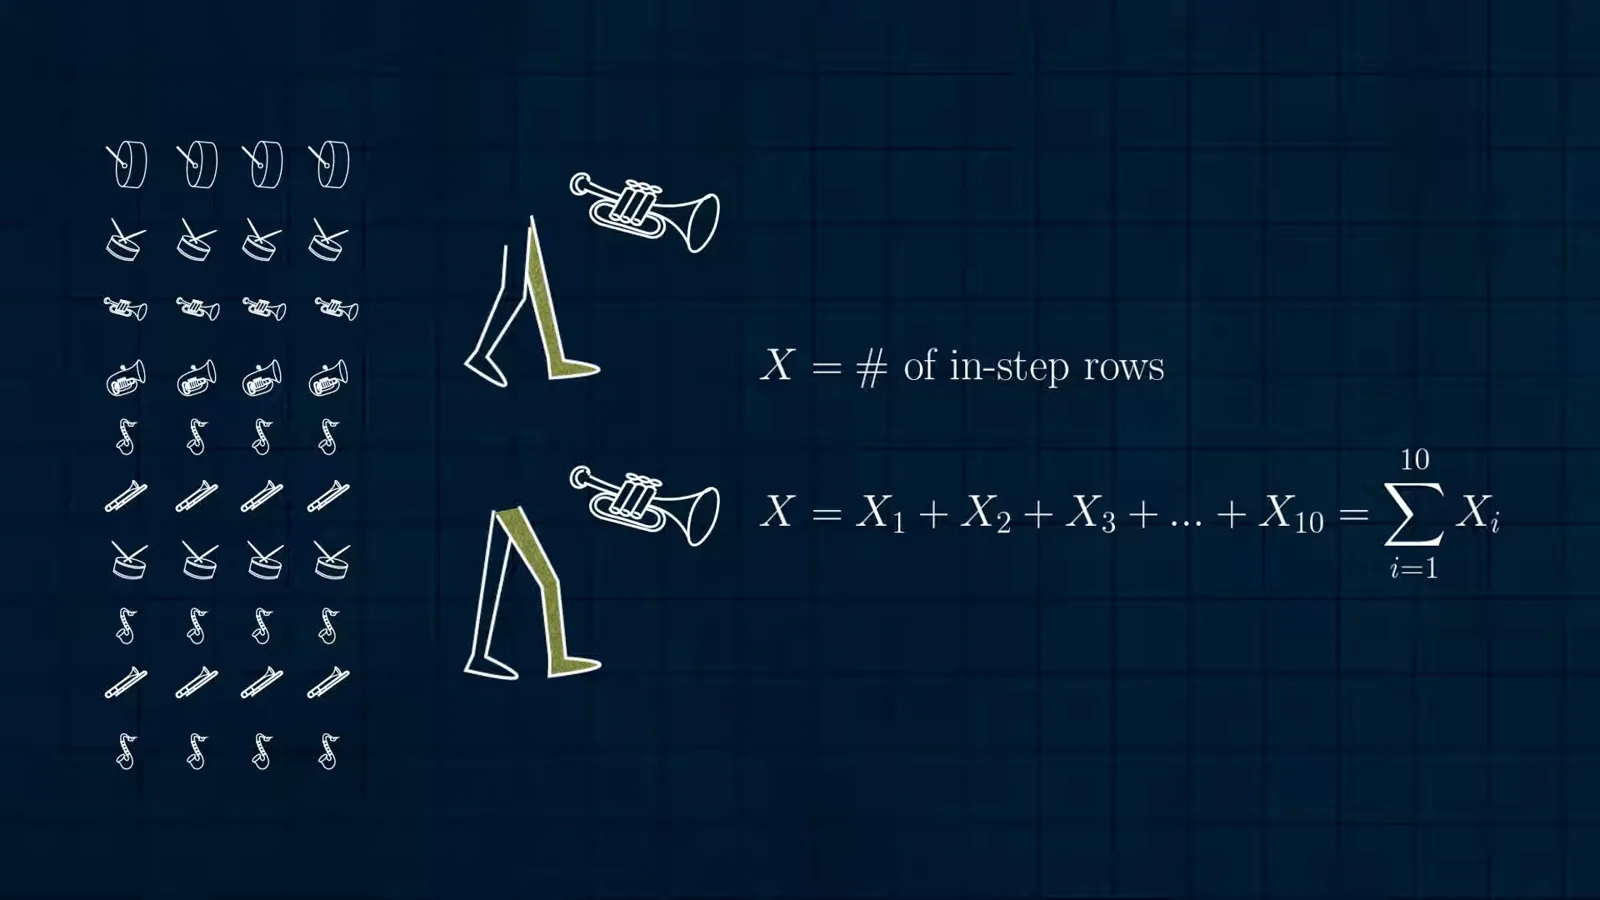
Let X be the number of in-step rows, and let Xᵢ be 1 if row i is in step and 0 otherwise. Then X is the sum of the ten Xᵢ. Such 0-or-1 variables are called indicator variables, and they turn a complicated count into simpler pieces.
The expected value of an indicator is the probability that its condition holds: 0 times the probability of failure plus 1 times the probability of success. For the first row, there are two ways to be in step: all four start left or all four start right.
Each of those outcomes has probability (1/2)⁴ = 1/16, so the probability a row is in step is 1/8. Every row has the same expectation. By linearity of expectation, the total is ten times 1/8, or 5/4: an average of 1.25 good photo opportunities.
A fixed split and dependent rows
With exactly 20 starters on each foot, the expectation changes to approximately 1.06. Linearity remains valid even though the row indicators are dependent.
The bonus question changes the distribution: exactly 20 musicians start on each foot, and they are randomly arranged in rows. We can use the same indicators, but the probability that a row is in step changes.
Whichever foot the first player uses, 19 of the remaining 39 players use that foot. The probabilities for the next two positions are 18/38 and 17/37. Thus the chance that the first row is in step is (19/39)(18/38)(17/37) = 51/481, or about 0.106.
All ten rows have that same expectation, so linearity gives 510/481, approximately 1.06 in-step rows. The indicators are not independent: whether one row is in step subtly changes the chances for another.
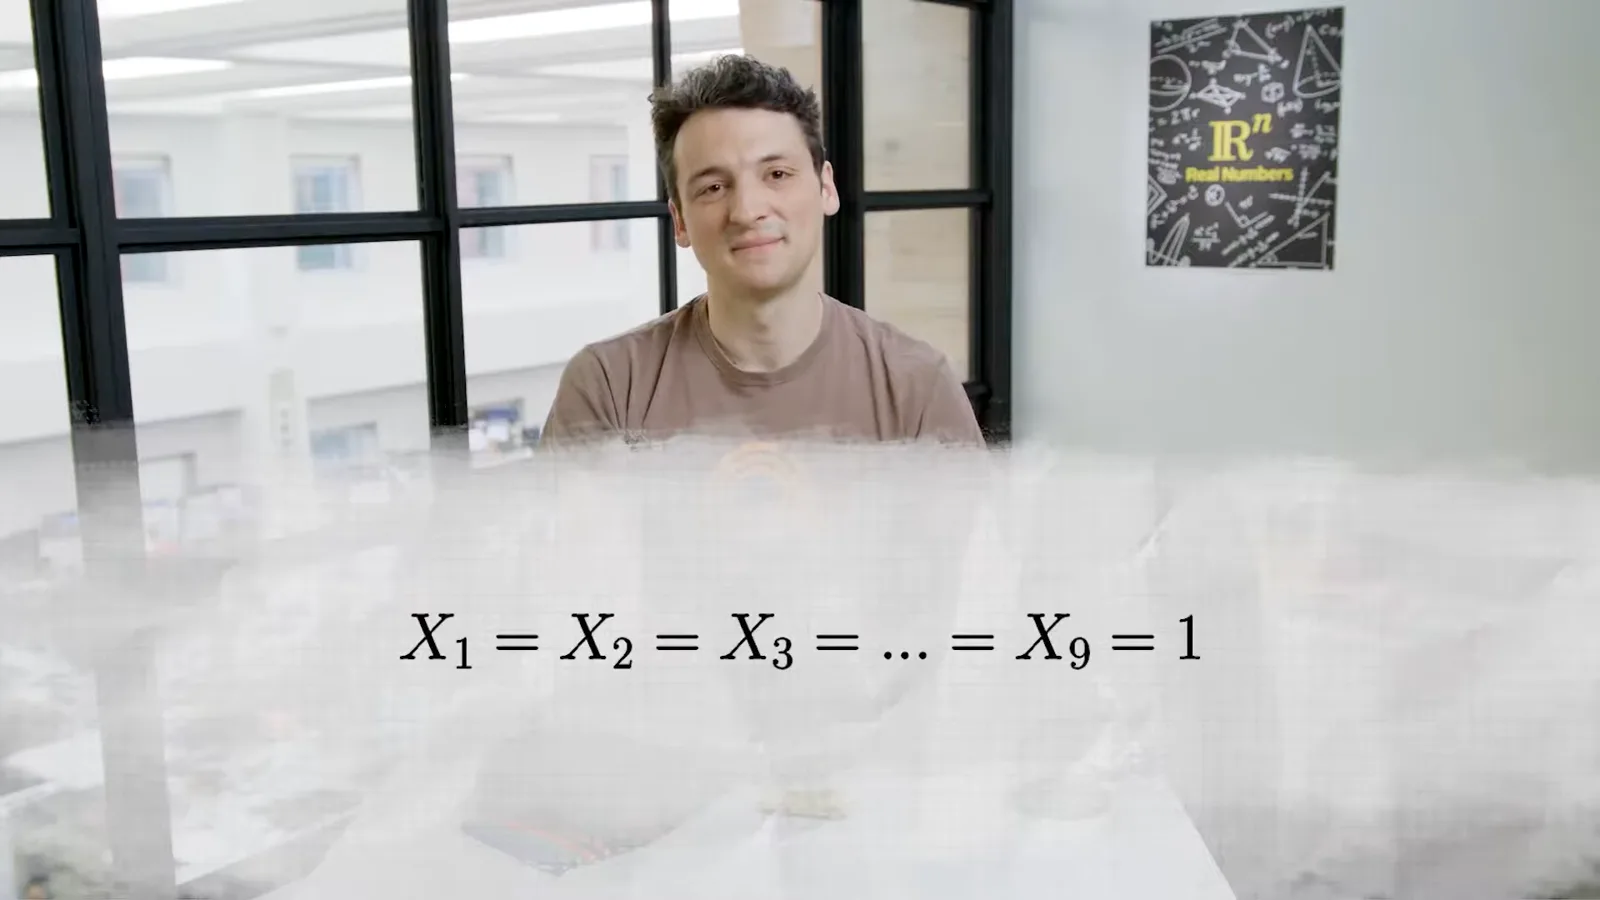
To see the dependence, suppose the first nine rows are all in step. Because there are exactly 20 starters on each foot, the four remaining musicians must all start on the same foot. The tenth row is then certainly in step, unlike its unconditional probability.
Linearity of expectation still applies even when the indicators are dependent, so we do not need to calculate all the interactions among rows. The expected count is lower than in the independent version: once three starters on a row use the same foot, fewer of that type remain to complete the row.
Return to snowboards
The episode closes by inviting viewers to apply the indicator-variable idea to the new question.
Now return to Rachel’s six lessons and six snowboards. Count the boards used at least once, perhaps by defining an indicator for each board. How many does she expect to sharpen?
同じチャンネルの記事
 1:48:29EN
 1:36:37EN
 1:05:45EN
 1:25:00EN
 1:16:29EN
 27:39EN