30 秒でわかる
Looker CLI began as Gazer, a way to move dashboards and saved Looks between instances, and now exposes a much wider set of Looker API operations. Creator Mike DeAngelo says agents can discover commands through help and search when needed, instead of putting every tool description into context at the outset. JSON request templates give agents a structure to fill in, while higher-level commands still help developers. His examples include finding test dashboards for review or deletion and checking an instance for slow queries and errors.
- 1The CLI grew from dashboard migration into broad API accessDeAngelo says the original Ruby Gazer moved Looks and dashboards between Looker instances. The Go rewrite retains specialized commands and exposes the Looker API more broadly.
- 2A command tree and keyword search help users find operationsThe meta commands show the available hierarchy and search for operations related to a term such as dashboard.
- 3An agent can find test content before deleting itDeAngelo asks an agent to locate test dashboards and Looks in a sandbox folder. He says omitting the deletion instruction would produce a list that a person can audit.
- 4CLI discovery loads information when neededDeAngelo says MCP tool descriptions can consume context when many tools are exposed. CLI help and skills allow an agent to discover commands as needed, while tailored MCP tools can serve common tasks.
- 5Empty JSON templates make API requests easier to constructThe CLI can return a template for an API request body. DeAngelo says agents handle filling the template more reliably than constructing its structure from scratch.
- 6Agents can compose fine-grained calls that once needed glue codeA dashboard import can require 15 to 20 API calls. DeAngelo says he previously packaged the sequence into code for developers, whereas an agent can perform smaller individual steps.
- 7A health check collects slow queries, errors and failuresThe health pulse command reports database connections, dashboard and Explore performance, dashboard errors and schedule failures.
ポイント
- Use command search and help to let an agent discover available operations as needed.
- Provide empty JSON templates so agents can fill in a valid request structure.
- List candidate test content before deletion when human review is desired.
- Use health checks to inspect database connections, dashboard performance, errors and scheduled-task failures.
- Keep both fine-grained API operations and higher-level commands available to suit agents and developers.
チャプターごとに整えた全文を読む
From Gazer content migration to Looker CLI
DeAngelo’s original Ruby utility moved dashboards and Looks between instances. Its Go rewrite adds a broader API surface and administration operations.
Chrissie Goodrich introduces Mike DeAngelo, who wrote Gazer and helped modernize it for agent use. He says Looker CLI is a command-line program for working with Looker, including copying dashboards and saved Looks between development and production instances.
The original Gazer, written in Ruby about eight years earlier, exported a Look or dashboard to JSON and made the necessary API calls to recreate it on another instance. DeAngelo says it grew to support tasks such as creating users, projects and data sources.
The newer CLI is a full rewrite in Go. It preserves specialized administration tools and adds broader coverage of the Looker API. DeAngelo names Josh Temple and Victor Poiesz as collaborators.
DeAngelo says a Looker instance can be brought into a running state through scripted CLI operations with little interaction. An integration test in the project repository deploys a project, creates a connection and runs queries against it.
Discover commands and clean a test folder
Command trees and keyword search expose the available operations. An agent can list test content or delete it when instructed.
The program uses a main command with subcommands. Its meta tree command lists the hierarchy, while meta search accepts a keyword such as dashboard and returns related commands. DeAngelo says he frequently uses commands for dashboard creation and deletion and folder listings.
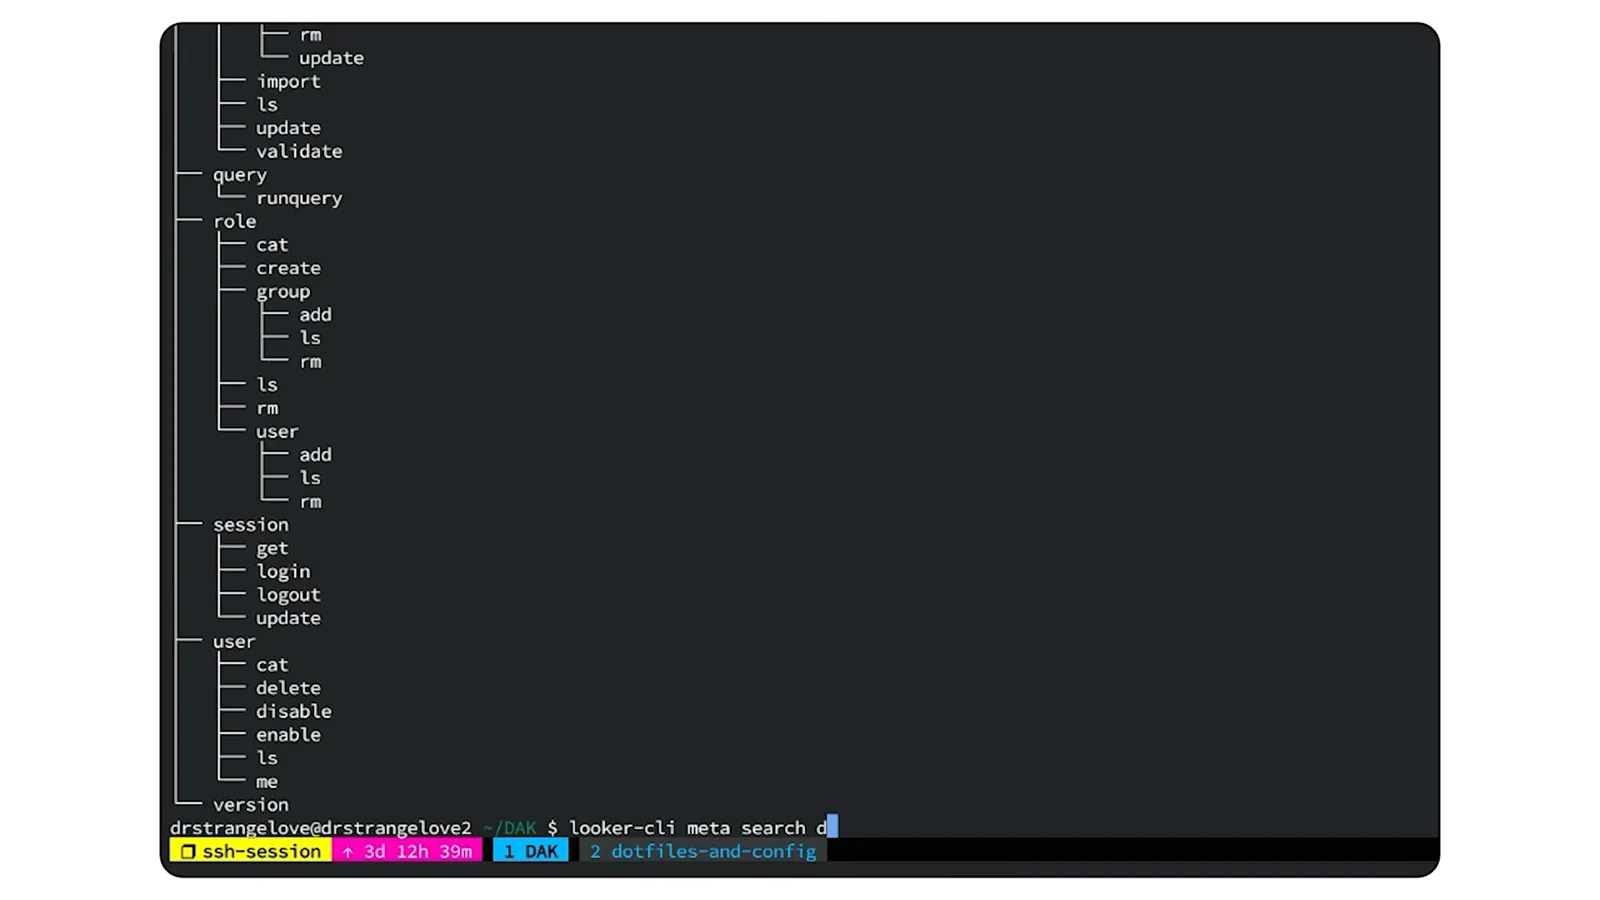
For a sandbox used in integration tests, DeAngelo asks an agent to find dashboards and Looks whose names start with “test” and delete them. Test runs can otherwise leave such content behind. If the request asks only for a list, he says, a person can review the results before deciding what to remove.
Design a CLI that agents can discover
Help, skills and JSON templates give agents information on demand. Fine-grained API calls complement higher-level tools written for developers.
Goodrich asks how a CLI differs from an MCP server for agents. DeAngelo says each MCP tool description takes space in the model’s context, so exposing hundreds of operations can be costly. He sees tailored MCP tools as useful for common tasks, and a CLI as a way to offer broad capability to technical users.
A CLI does not initially put all its command descriptions in the context window. Instead, an agent can discover what it needs through help and search; Looker skills supply additional guidance. DeAngelo says the information arrives as needed rather than being loaded in full at the outset.
For API calls, a template option can return an empty JSON request body. DeAngelo says agents are good at filling out that structure compared with creating it from scratch. JSON also gives both scripts and agents a convenient input and output format.
Designing for developers and agents overlaps, but DeAngelo says their preferred granularity can differ. For a developer he packaged complex operations into higher-level tools: importing a dashboard could require 15 to 20 calls to create the dashboard, filters and elements and arrange the layout.
An agent can instead discover and execute those finer-grained operations without the developer writing all the glue code in advance. Goodrich says she has used the same CLI manually and with an agent to create LookML for a demonstration, and values being able to switch between the two modes.
Keep API coverage current and check instance health
The CLI follows Looker releases and incorporates health-check features. Its pulse command reports connection, performance and failure information.
DeAngelo says the CLI is updated as Looker releases add API calls, producing a roughly monthly release rhythm. The team has also incorporated health-check capabilities from the open-source Henry tool.
In a demonstration, Goodrich asks an agent to check the pulse of a Looker instance. DeAngelo explains that the health pulse command checks database connections, slow queries and dashboards, dashboard errors, Explore performance and scheduled-task failures.
As the results return, the speakers point to query counts by connection, dashboard performance and errors, and Explore performance. DeAngelo says he uses the CLI a couple of times a week and expects an administrator might use it daily, including to inspect alert failures.
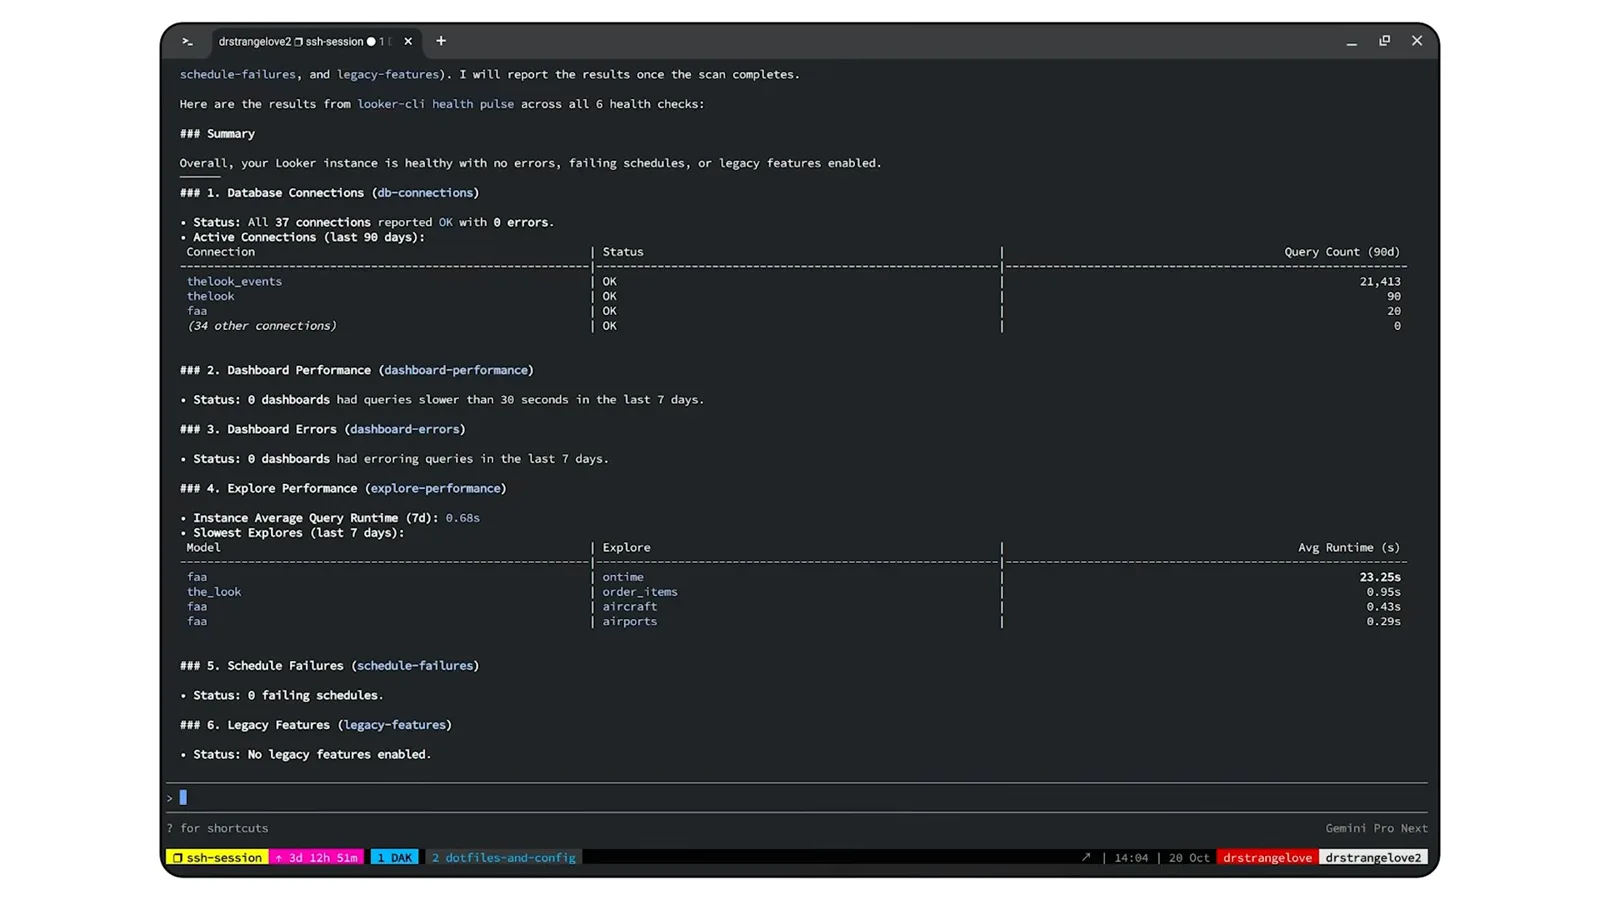
DeAngelo says the CLI can help agents administer an instance and update LookML. Although the speakers work at Google and mention Gemini and Antigravity, he says it can also be used with tools such as Claude and ChatGPT.
同じチャンネルの記事
 15:19EN
 Google Cloud Tech· 2026年11月17日Give a Voice Agent Memory Without Sending Its Whole TranscriptLaxmi Harikumar, Miles Libbey · Google CloudA 40-word window and persistent facts cut classifier input in a Scribant demo while keeping user preferences across sessions.
 55:11ENGoogle Cloud Tech· 2026年11月14日A no-code AI app build: diagnose the system before asking for a fixDevin Chasanoff · Google CloudDevin Chasanoff builds a workout coach in stages, using tests and context tracing to fix an API connection and unintended plan changes.
 13:01ENGoogle Cloud Tech· 2026年11月12日Build an Agent Evaluation That Checks Every Guest’s NeedsAnnie Wang · Google CloudAnnie Wang builds a custom ADK metric that scores restaurant plans against group requirements and runs it in CI/CD.
 23:57ENGoogle Cloud Tech· 2026年11月10日Six front-end ideas that make AI-built apps easier to debugDevin Chasanoff · Google CloudDevin Chasanoff uses an interactive game tracker to show where data lives, how values are derived and how components communicate.
 41:04ENGoogle Cloud Tech· 2026年11月9日How Google tests Gemini 4 and uses agents to maintain codeTulsee Doshi, Smitha, Rody Davis, Luke, Mollie, Billy, Annie · Google DeepMindTulsee Doshi describes staged releases and long-running work; a demo audits web, Android and iOS code with subagents.
 17:27ENGoogle Cloud Tech· 2026年11月9日Fix a tangled app by specifying its states before promptingDevin Chasanoff · GoogleDevin Chasanoff maps a workout screen’s state, transitions and tests before asking an agent to change it.