En 30 secondes
A workflow graph decides what an AI application does next; a data graph helps it find related information. Google Cloud presenter Annie Wang illustrates the distinction with a refund request: parallel checks retrieve the order, payment and customer history, rules route the case to a person, and the model drafts a reply only after approval. The same facts could be retrieved with table joins, and a single agent may be sufficient for a small task. Graphs add structure but also require maintenance and can increase cost and latency.
- 1A required human decision needs a workflow that can pauseTelling a single agent to wait does not guarantee that it will. In the refund example, the application explicitly pauses when the rules require review.
- 2Steps and dependencies form a workflow graphNodes can be functions, model-based agents or human-input steps; edges show dependencies and conditional routes. Parallel checks join before the rules run.
- 3A small task may not need a graph at allWang says a few functions or one agent with tools may be sufficient. A graph is useful when the steps and their relationships need to be visible and controlled.
- 4Following relationships finds refund facts missing from the orderThe $62 order alone lacks the payment-dispute status and customer’s previous refunds. Following its links retrieves both.
- 5A graph query is one way to retrieve connected recordsThe demo uses BigQuery Graph and written queries, but table joins and other retrieval approaches can also gather the facts. Defining relationships and following extra connections bring maintenance and runtime costs.
- 6The workflow queries the data graph, then applies its rulesA query connects the two graphs. The workflow uses returned facts, waits for a human decision where necessary, and gives the decision to the model to draft the reply.
À retenir
- Use workflow control to enforce a required human review rather than relying on an agent instruction to wait.
- Follow data relationships when the answer depends on facts in connected records, not just a matching passage.
- Consider simpler functions or one agent for small tasks; graph structure takes work to build and maintain.
- Compare a combined data query with parallel reads for latency and cost in the actual application.
- Retrieve only relevant connections: more traversal can increase expense and supply unnecessary context.
Lire le texte remanié, chapitre par chapitre
A refund illustrates two different graphs
A data graph returns the facts; a workflow graph controls the steps and pauses for review. The reply is drafted after the human decision.
Why do graphs keep appearing in AI? I will distinguish two uses: workflow graphs control what happens next, while data graphs connect records that provide an agent with context. We can put both into the same application.
Consider a customer asking for a refund. The workflow retrieves the order, payment and refund history from a data graph. The refund rules send this case to a person; after I add a reason and approve it, the AI drafts a reply using the facts and my decision.
Design a workflow around checks and human review
Nodes describe work and edges describe dependencies or routes. The checks can run in parallel before rules decide whether a person must review the case.
To make “handle this refund” executable, break it into checks for the order, payment and refund history, apply rules, request review where necessary, and draft a response. One agent could be instructed to do all this, but an instruction to wait for a person does not guarantee that it will pause.
Draw a box for each stage and connect them. Some checks are independent and can run together; others depend on earlier results. A decision can send the work along different paths. The sketch is a graph: each step is a node, and an edge describes a connection or dependency.
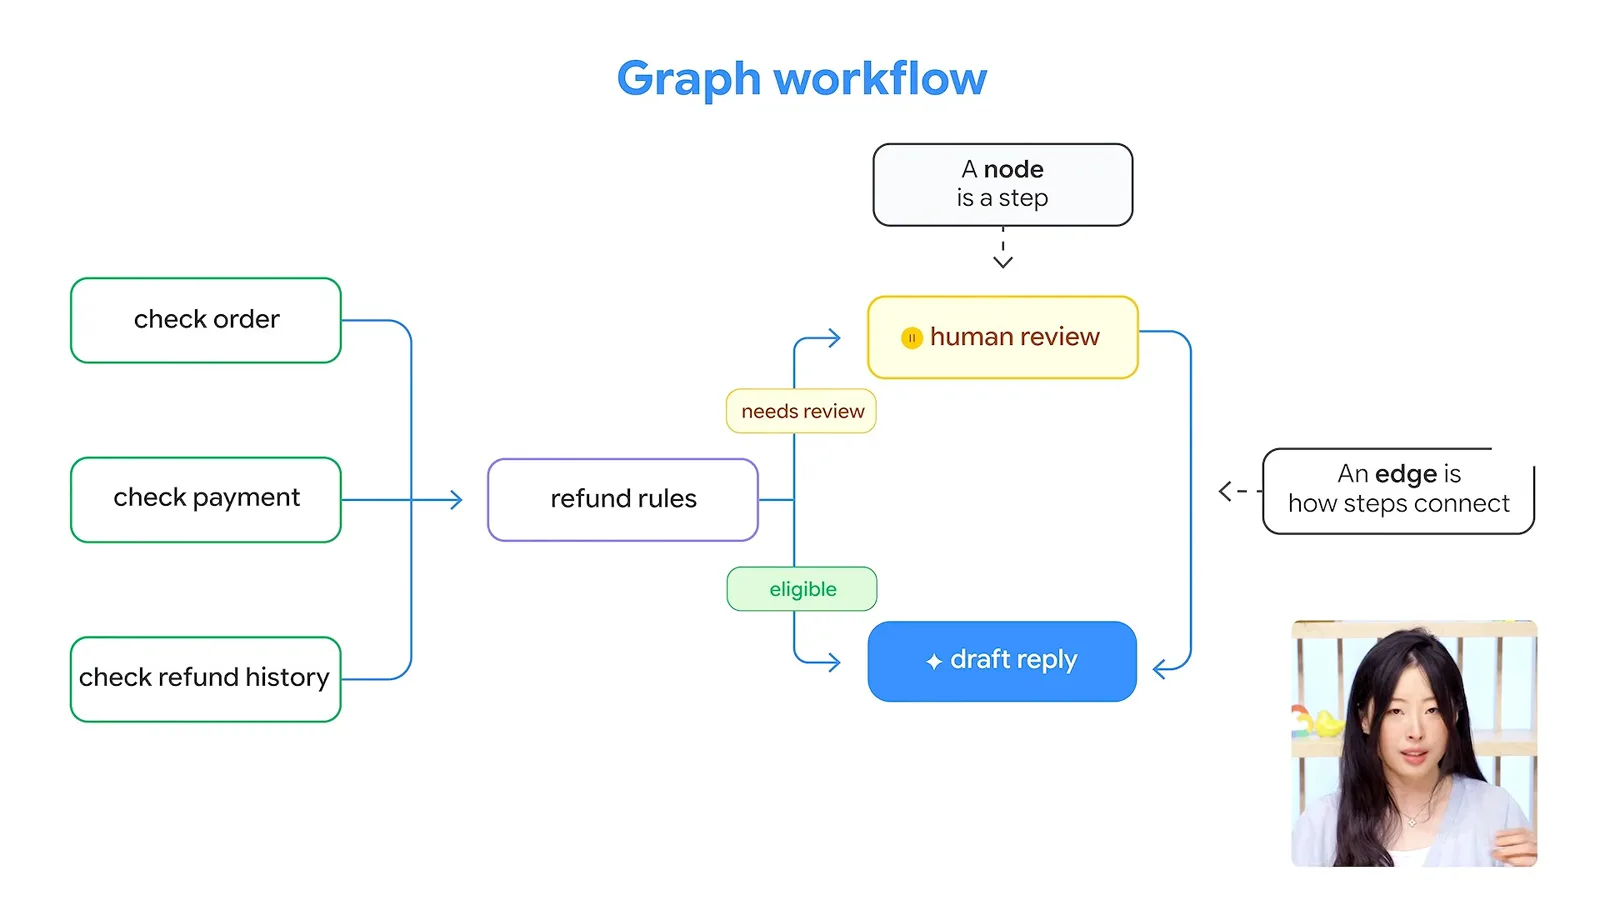
Parallel paths, routing, parent and child agents, and loops are all patterns that can be represented this way. A real application can combine them to show where work splits, where results meet and where a person enters the process.
Each node can do something different: read records, apply a rule, ask a model to draft a reply or wait for human input. In the refund flow, the rules wait for all three checks; their result selects the next path, including human review when necessary.
Graph engineering designs both those steps and their connections, then expresses them as a runnable workflow in code. I use Google’s Agent Development Kit for the demonstration. It lets us choose a model for the reply while code handles required checks and waits.
The three checks run in parallel, the rules wait for their results, and this particular case is routed for human review. Once I approve it, the response agent drafts the reply. Building and maintaining that structure takes effort, however: for a small task, a few functions or a single agent with tools may be enough.
Retrieve context by following connected records
A matching order does not necessarily include the payment and refund-history facts required by the rules. Following relationships gathers those facts for the model.
The workflow also needs information about the order and customer. Retrieval-augmented generation, or RAG, looks up relevant information and gives it to a model before it answers. Vector search can find passages with similar meaning, but a matching passage may not contain every fact the task needs.
GraphRAG uses relationships as part of retrieval. One approach begins with a relevant record, then follows its connections to gather more context. The relationship gives us a reason to retrieve another record, though the overall pattern is still retrieval followed by generation.
In the example, an order record tells us that a pair of trail-running shoes cost $62 and was purchased 12 days ago. That is not enough for the refund rules: they also need to know whether the payment has an open dispute and how many refunds the customer has received in the past year.
The customer, order, payment and refund-history summary are nodes in the data graph. Their connections say who placed the order, which payment belongs to it and which history belongs to the customer. Following those links shows no open dispute and one refund in the preceding 12 months.
The relationships explain why those facts belong to this case: we are checking this order’s payment and this customer’s history. Starting with the order and following the connections builds the context needed for the rules. In this case, those rules call for human review before the model drafts a reply.
Choose when graph retrieval is worth its cost
BigQuery Graph queries relationships over existing tables, but joins can also retrieve the facts. Maintaining relationships and traversing extra records adds work and cost.
I use BigQuery Graph to define relationships over BigQuery tables and retrieve the connected records with Graph Query Language. The demonstration starts with an order number and uses queries written in advance. Table joins could retrieve the same facts, and ordinary RAG can also retrieve multiple pieces of information.
Defining and maintaining graph relationships takes work. Following more connections can add latency, cost and information that the task does not need. We must still select relevant facts, and the model can still make mistakes.
Connect the workflow and data graphs
A workflow step queries the data graph and then applies rules to the results. A production system should compare the cost and latency of parallel reads and a combined query.
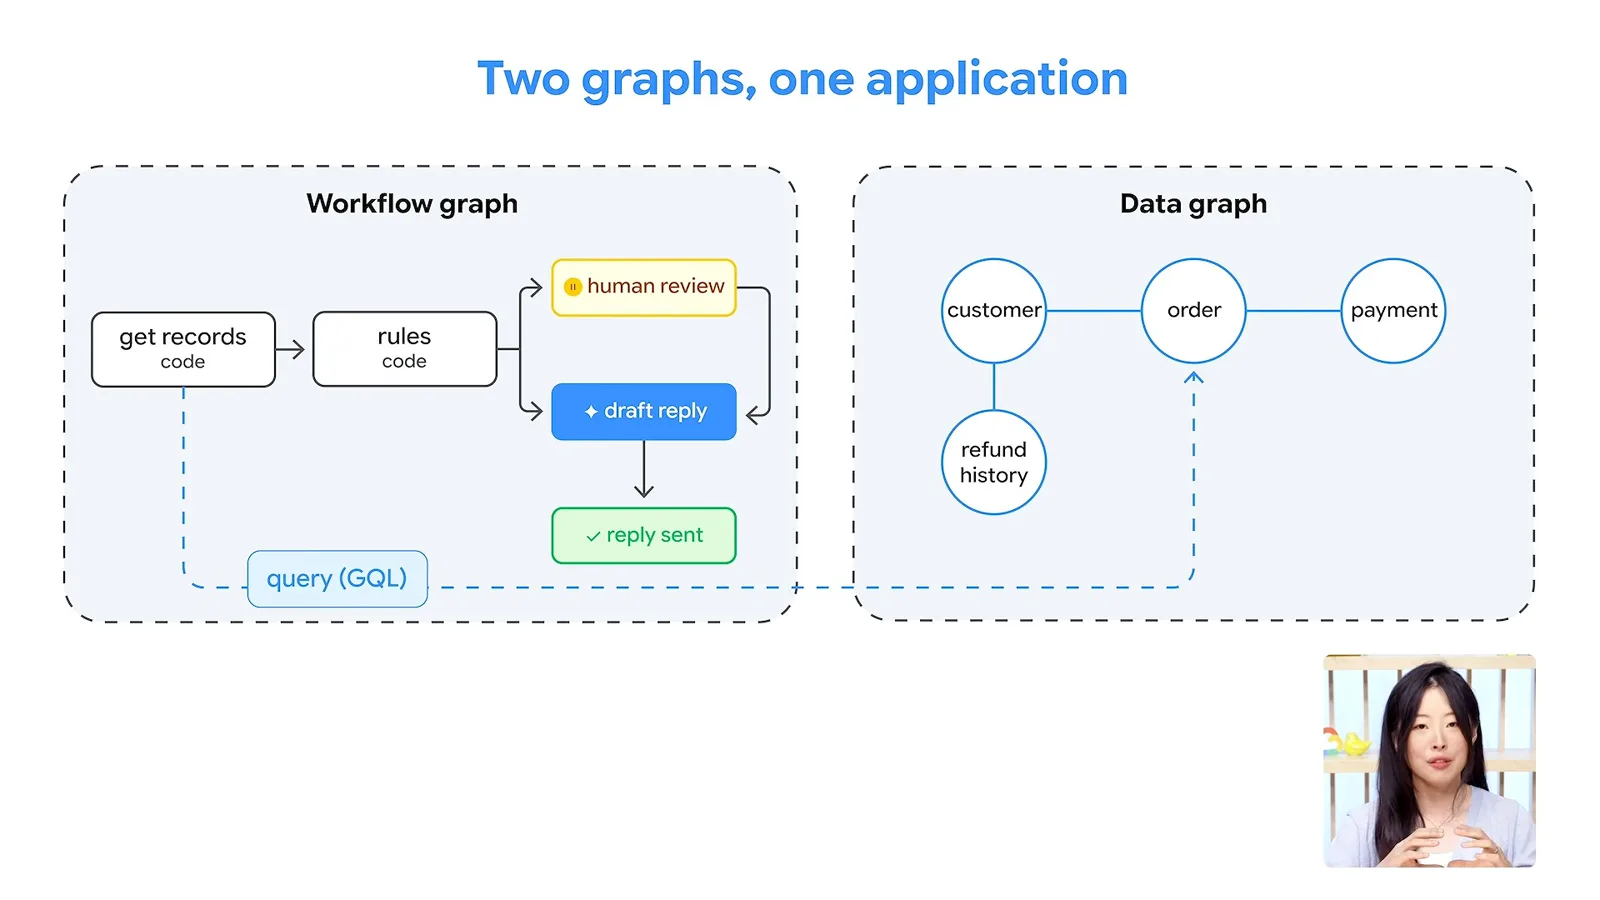
Putting the two graphs together, a workflow step queries the data graph, receives connected facts, applies the rules and waits for a human decision where required. It then passes the facts and decision to the model to draft a reply. One graph connects pieces of work; the other connects pieces of information.
The demonstration uses three reads to make parallel work visible, but one combined query can retrieve the same facts. For a live application, compare their latency and cost. Start with the problem, the actions it requires and the information those actions need; not every AI application needs a graph.
Sur la même chaîne
 15:19EN
 Google Cloud Tech· 17 nov. 2026Give a Voice Agent Memory Without Sending Its Whole TranscriptLaxmi Harikumar, Miles Libbey · Google CloudA 40-word window and persistent facts cut classifier input in a Scribant demo while keeping user preferences across sessions.
 31:46ENGoogle Cloud Tech· 17 nov. 2026Build an Inspector That Makes UI States Easy to TestDevin Chasanoff · Google CloudDevin Chasanoff isolates real components, adds state presets and turns the workflow into reusable agent skills.
 16:12ENGoogle Cloud Tech· 16 nov. 2026Looker CLI Lets Agents Discover and Run Admin TasksChrissie Goodrich, Mike DeAngelo · Google CloudMike DeAngelo explains how command discovery and JSON templates let agents use Looker’s API without loading every tool description at once.
 55:11ENGoogle Cloud Tech· 14 nov. 2026A no-code AI app build: diagnose the system before asking for a fixDevin Chasanoff · Google CloudDevin Chasanoff builds a workout coach in stages, using tests and context tracing to fix an API connection and unintended plan changes.
 13:01ENGoogle Cloud Tech· 12 nov. 2026Build an Agent Evaluation That Checks Every Guest’s NeedsAnnie Wang · Google CloudAnnie Wang builds a custom ADK metric that scores restaurant plans against group requirements and runs it in CI/CD.
 23:57ENGoogle Cloud Tech· 10 nov. 2026Six front-end ideas that make AI-built apps easier to debugDevin Chasanoff · Google CloudDevin Chasanoff uses an interactive game tracker to show where data lives, how values are derived and how components communicate.