En 30 segundos
After speaking with roughly 100 companies, Pratyusha Duvvuri found that “tokenomics” means different things to engineers, managers and finance teams. She defines it as making token usage and cost observable and interpretable, then demonstrates a dashboard that combines provider spending with workforce and finance hierarchies. Custom pricing, revised bills, changing teams and access controls make attribution and forecasting difficult; her team says it brought the product from initial customer conversations to general availability in ten weeks.
- 1The right model depends on the jobDuvvuri describes a 96% versus 99% evaluation comparison and says an internal workflow may justify a cheaper model while customer-facing work may justify the higher cost.
- 2Separate provider dashboards do not give a unified financial viewTeams must combine usage, customized prices and reconciled bills across providers.
- 3Tokenomics means observable and interpretable usageHer definition links token consumption and cost to model choices, ownership and business outcomes.
- 4Attribution needs organizational and finance hierarchiesThe product uses provider information and company structures to roll spending up by individual, team and finance department.
- 5Changing bills and teams make reconciliation difficultProvider invoices can be revised while employees and reporting lines also change.
Conclusiones
- Engineers, engineering managers and finance teams ask different questions about the same AI spending.
- Model choice involves a tradeoff among cost, evaluation quality and the importance of the use case.
- Custom provider agreements make a single public price insufficient for interpreting every bill.
- Spending needs to be mapped to both organizational and financial ownership, with appropriate access controls.
- Reconciliation and changing employee or team assignments complicate historical attribution.
Lee el texto editado por capítulos
Why tokenomics has no single definition
Duvvuri describes customer interviews and changing attitudes toward AI spending. She uses model evaluations to illustrate cost-quality tradeoffs.
Pratyusha Duvvuri asks the audience what tokenomics means and predicts that answers will differ. Her team spoke with about 100 companies and heard requests ranging from token-cost visibility to a complete return-on-investment breakdown by team.
Duvvuri introduces her work on agent observability, distributed tracing and tokenomics at Galileo, which became part of Cisco through acquisitions. She says she will offer a working definition rather than claim the term has one settled meaning.
She describes a shift from celebrating high token consumption toward asking about efficiency. As AI tools spread, leaders increasingly want to understand whether spending is producing useful outcomes.
Model choice illustrates the tradeoff. In an internal use case, a cheaper model scored 96% on the team’s evaluations while a more capable model scored 99%; Duvvuri says the team kept the cheaper model because its quality was sufficient for that use.
For a customer-facing task, she might instead accept higher cost for an improvement in quality. The decision depends on the evaluation, the consequences of errors and the value delivered, not on token price alone.
Provider pricing adds another complication. Duvvuri says enterprise agreements can differ by customer, credit price and usage thresholds, so advertised list prices do not always explain an organization’s actual spending.
Engineers, managers and finance need different views
The same token spend raises different questions for each group. Provider-specific dashboards and custom agreements complicate the picture.
Her team groups the product’s users into engineers, engineering managers and finance staff. Each group needs a different view even when they are looking at the same underlying usage.
An engineer may want to know which models and skills are being used and whether a monthly budget is being exceeded. The immediate question is how to adjust a specific workflow or model choice.
An engineering manager may compare adoption, results and costs across teams. A team spending more may be producing better outcomes, while a cheaper team may be missing its targets; usage figures need context.
Finance teams need budgets, alerts, spending attribution and a defensible explanation of return on investment. Duvvuri compares variable token billing to riding in a taxi without knowing the final fare.
She argues that provider-specific dashboards leave users switching among vendors. They may also fail to address all three audiences, especially when finance needs a consolidated view across different agreements.
Reconciliation makes the figures less static than a dashboard suggests. A provider can revise a previously reported charge, so a consolidated system needs to update and explain differences between earlier estimates and later bills.
Finance ownership can also differ from a standard management hierarchy. The way an organization allocates operating expenses and cost of goods sold does not necessarily match the reporting lines in its workforce system.
Connecting usage, ownership and costs
Duvvuri defines tokenomics and explains the provider, workforce and finance data needed to attribute spending.
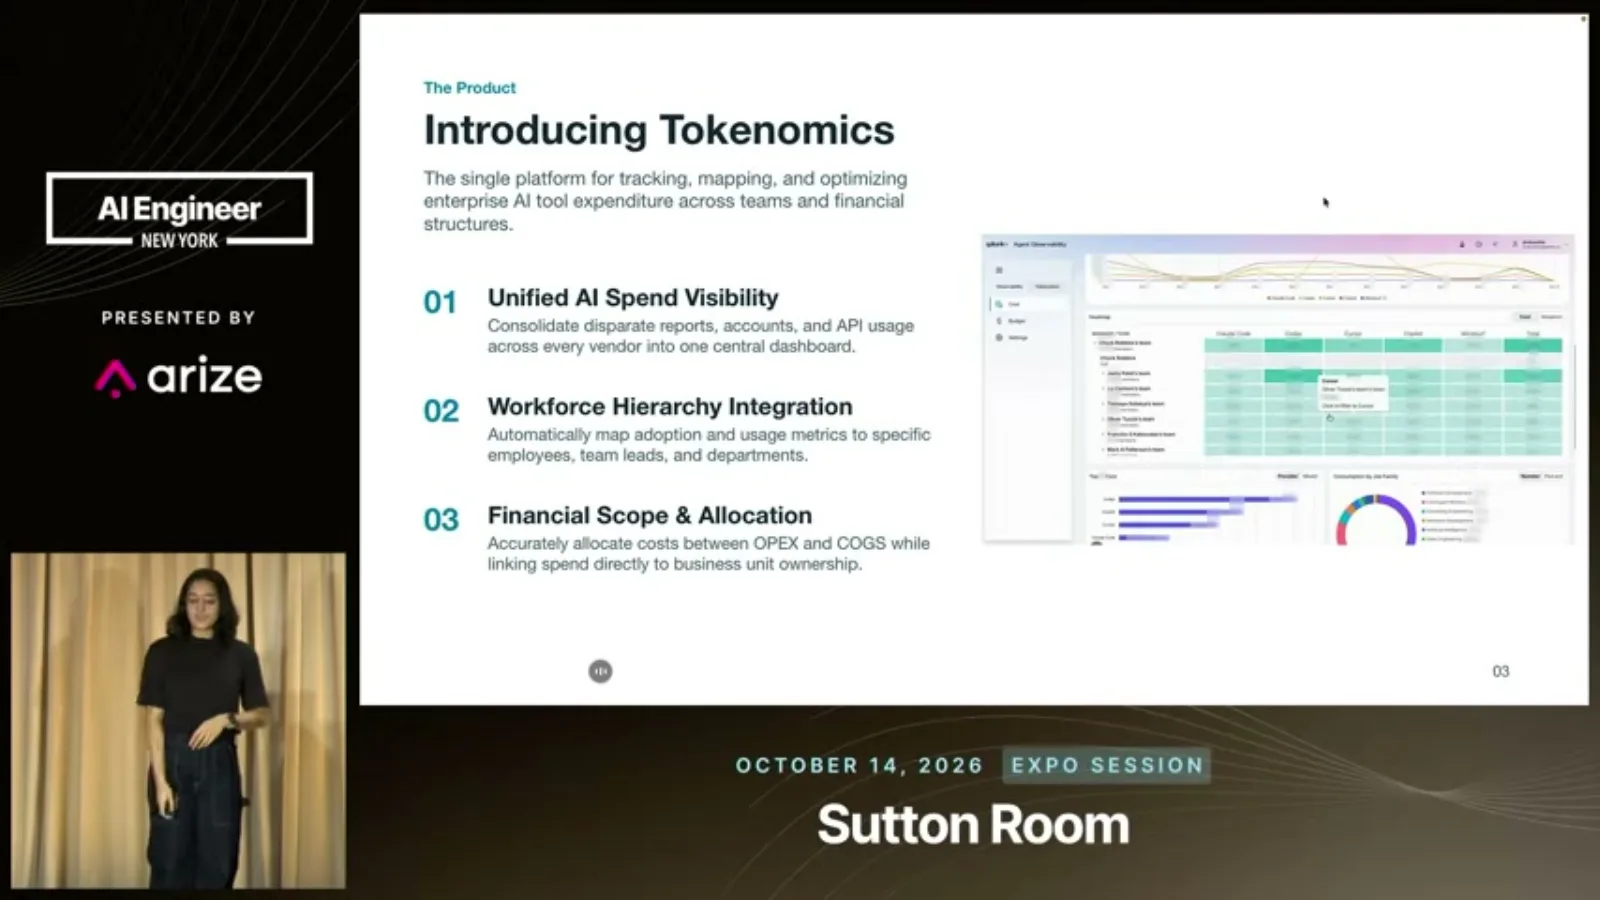
Duvvuri defines tokenomics as the observability and interpretability of token usage and cost. For her, interpretation includes understanding model choices, categorizing use cases and connecting spend to return on investment.
To populate the product, her team requests a workforce hierarchy, provider API credentials and organization identifiers, plus a finance hierarchy. It uses provider data to refresh the usage view on roughly a daily cadence.
Customers may be sensitive about sharing workforce data. Duvvuri says the team accepts a CSV containing a limited set of fields, such as names, IDs and job functions, rather than requiring every detail in a human-resources system.
Dashboard demonstration
The demonstration shows cost and adoption trends, organizational rollups and a finance hierarchy. Access controls limit who can see each view.
In the demonstration, numerical values are blurred. The leader view offers date filters, a fiscal calendar, cost and adoption dashboards, and trends that let managers see whether teams are using AI tools and how spending changes.
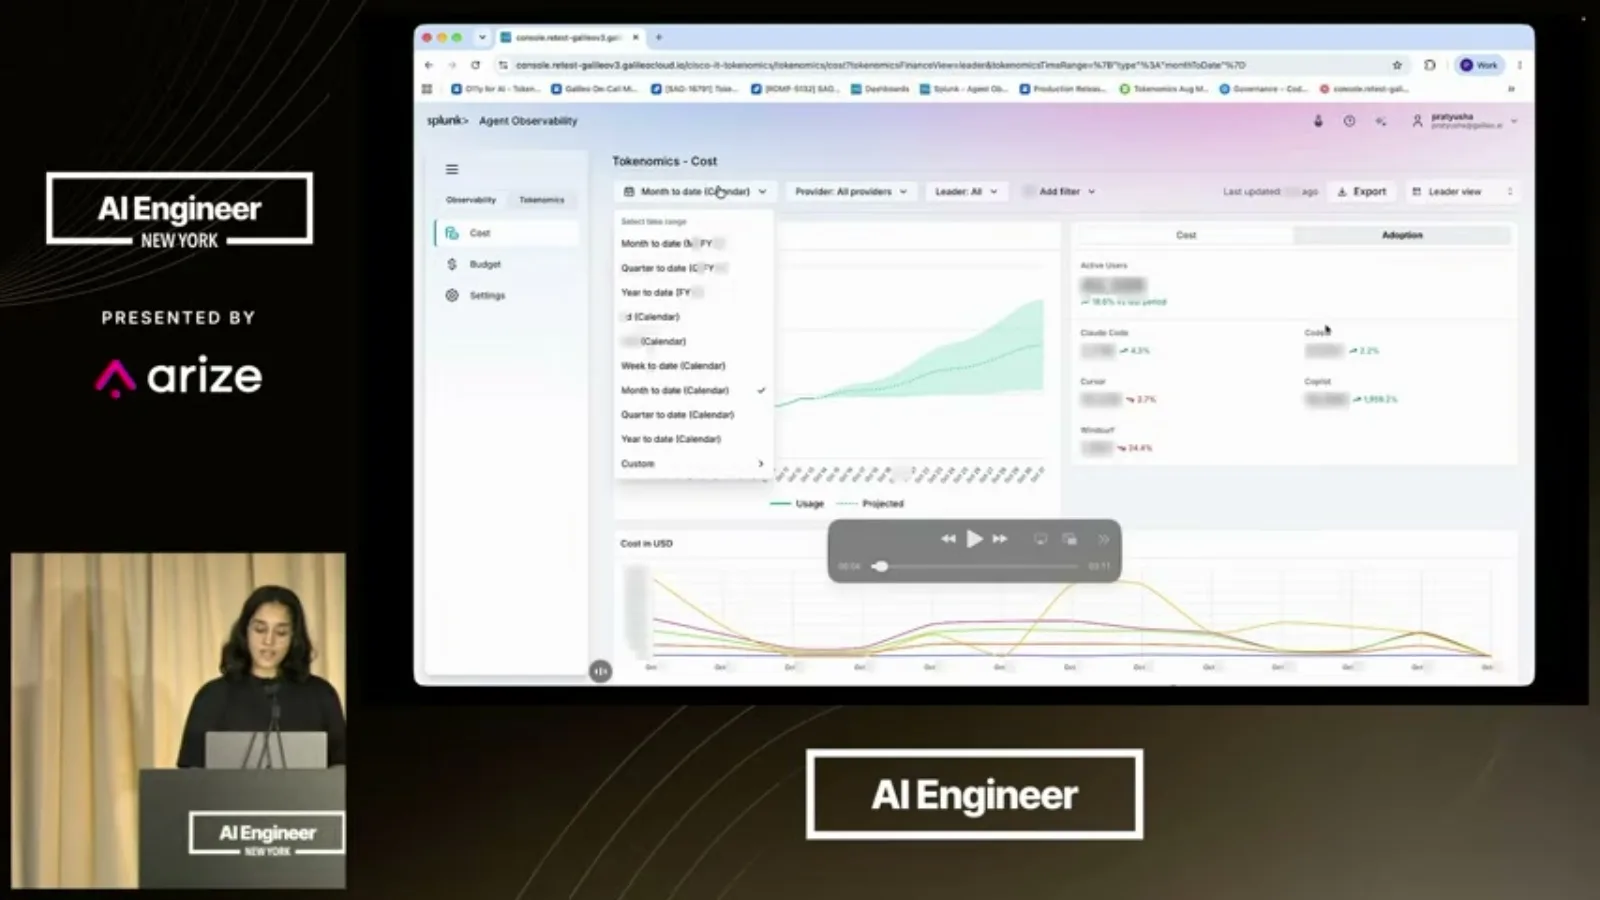
Forecasting is a frequent request from both managers and finance, she says: they want to know whether a budget may be exhausted within a week or a month. The demonstration includes a projected usage view with considerable uncertainty.
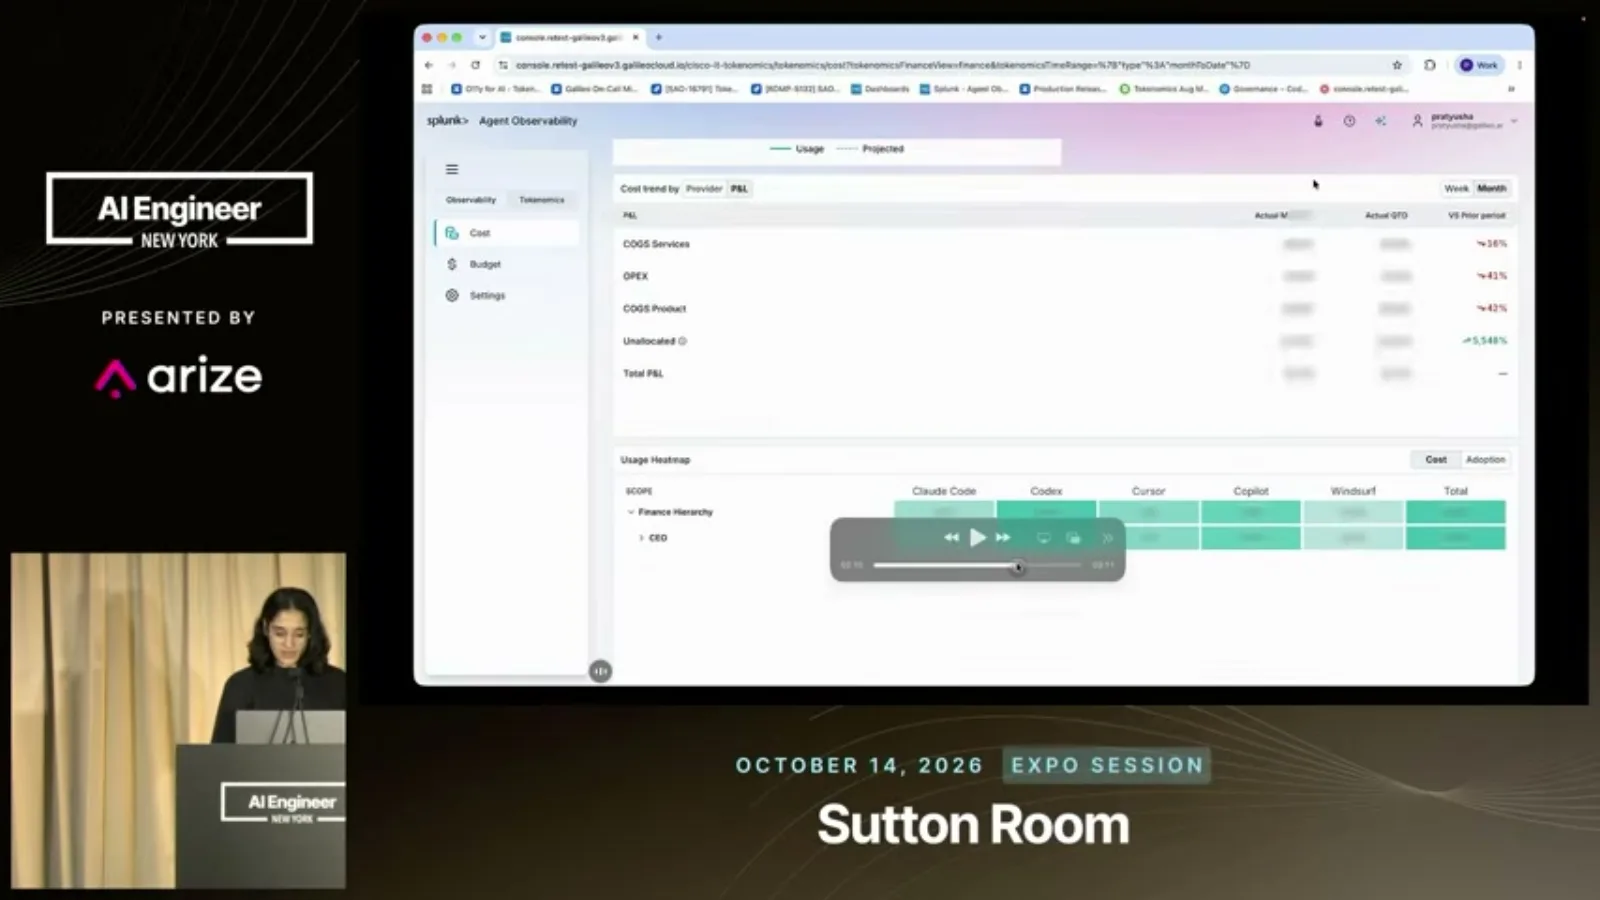
An organizational tree rolls spending up from individuals to managers and executives. A user can move down the hierarchy to inspect team and individual usage rather than seeing only the company-wide total.
The product can also group consumption by job family, allowing a leader to compare sales, product and engineering. Other filters include model, reasoning setting, person and job function.
The finance view follows a different hierarchy of departments and cost categories. Duvvuri says each person’s cost rolls into a finance node, while role-based access rules restrict which teams a viewer can inspect.
Building and operating the product
The team reports a ten-week path to general availability. Duvvuri discusses forecasting, changing requirements and reconciliation.
She says the team moved from initial customer conversations to a generally available product in ten weeks. She describes demand for forecasting and for linking token spend to outcomes such as a migration, a product launch or customer acquisition.
One challenge is designing a scalable product while both the market and customer requests are changing. A new requirement can force changes to a data model already serving a large user base.
Another challenge is keeping the interface simple for three audiences with very different needs. Reconciliation is a third: provider data can change after it was first reported, and the product must reflect those revisions.
People and reporting lines also change over time, creating difficult questions about historical cost attribution. Duvvuri ends by inviting the audience to reconsider what tokenomics means for their own organization.
Más de este canal
 19:41EN
 AI Engineer· 9 nov 2026A high-reliability automation starts by routing the hard cases awayMatthew Jewkes · Standard CyberneticsMatthew Jewkes describes separating critical errors, ambiguous decisions and unusual exceptions in a biopharma indexing workflow.
 22:01ENAI Engineer· 9 nov 2026Zach Lloyd: make the software factory measurable and editableZach Lloyd · WarpWarp’s CEO proposes recording agent runs, scoring failures and testing changes to the workflow on real tasks.
 27:35ENAI Engineer· 9 nov 2026Uber traded an always-green trunk for faster AI-scale mergesPreetam Dwivedi, Manjari Akella · UberIts merge queue now relaxes some conflicts and validates the combined state after landing, with a verified-good fallback.
 15:25ENAI Engineer· 9 nov 2026Hassan and Omar El Mghari: When an AI financial forecast is right for the wrong reasonsHassan El Mghari, Omar El Mghari · Together AIA Costco membership-fee model passed basic checks and landed close to reported results, but an audit uncovered offsetting assumptions.
 14:38ENAI Engineer· 9 nov 2026Jemima Abu: Give coding agents accessibility rules from the startJemima Abu · CAISA product engineer shows how semantic HTML, reusable components and explicit agent skills can help teams build more usable interfaces.
 21:12ENAI Engineer· 9 nov 2026Tom Moor: Give coding agents the product context that code cannot showTom Moor · LinearLinear’s workflow carries customer requests, past decisions, review history and human feedback from intake through implementation and review.