In 30 seconds
A fast microbenchmark can optimize the wrong problem if it repeatedly exercises hot cache lines and predictable branches while production does not. Citadel Securities engineer Kris Jusiak recommends profiling first, then measuring the actual machine-code region under realistic and deliberately adverse input, branch and cache distributions. He demonstrates a perf extension that combines symbolic path exploration with a native benchmark harness and hardware counters. The goal is to compare latency distributions and ask what happens when conditions change, rather than trust one average or assume a tight loop represents a single production call.
- 1Sampling can miss the rare event that mattersA profiler may spend most samples on an idle loop. Jusiak compares sampling with probes, instrumentation and processor tracing, each with different overhead and detail.
- 2A tight benchmark loop may measure throughput instead of latencyThe processor can overlap repeated work, while a production path may care about a single operation. The compiled code and runtime conditions must also match the question.
- 3The proposed harness tests machine code across execution pathsJusiak combines symbolic path exploration, input generation and native execution to vary conditions without rewriting the original source. He describes path explosion as a practical limit.
- 4Branch history and cache placement change the same code’s timingHe demonstrates using inputs and cache-control techniques to explore different predictor and memory states, with examples tied to specific hardware.
- 5Compare best, observed and adverse cases, not one numberProduction inputs can inform a distribution; additional scenarios test what might happen if conditions change. Empirical distribution plots make tails visible.
- 6The question is what could happen, not only what happened todayIn Q&A, Jusiak explains that the harness uses original machine code with synthesized data and memory conditions, enabling isolated what-if measurements.
Takeaways
- Profile the workload and identify the bottleneck before choosing a microbenchmark.
- Distinguish single-operation latency from repeated-loop throughput; they answer different questions.
- Test input, branch and cache distributions that resemble production as well as plausible adverse cases.
- Control background noise and verify the compiled machine code, because layout and compiler changes can alter results.
- Compare full distributions and tail behavior, not only an average; choose statistical tests appropriate to the data.
- Use production measurements to inform isolated experiments, then repeat profiling and benchmarking after changes.
Read the edited text by chapter
Why measurement is hard on modern CPUs
Jusiak scopes the talk to x86 and Linux and explains how hardware complexity makes source-level intuition unreliable.
Kris Jusiak frames performance measurement as an engineering problem: if the measurement is misleading, an optimization may move the wrong metric or even make production slower. His examples focus on CPU behavior, x86 and Linux.
He cautions that performance spans many concerns and has no single universal fix. For this talk he narrows the scope to CPUs and uses Linux perf with extensions, plus other tools, to inspect hardware and software behavior.
Some processor details are public and others are difficult to observe directly. Jusiak credits published manuals, reverse engineering and experiments for making microarchitectural behavior more understandable; measurements still depend on the processor and setup.
Clock frequency has not scaled in the same way as transistor count, he says. Modern processors instead use larger caches, branch prediction and other machinery to improve execution. Those mechanisms improve speed but make performance harder to infer from source code alone.
He asks the audience whether apparently harmless changes—an untaken branch, an unused function, debug symbols or a different user—can alter performance. The question introduces his “what if” approach: ask how a result changes when inputs, layout or runtime conditions change.
For data-dependent systems, tomorrow’s input distribution may differ from today’s. Jusiak wants engineers to ask what happens if branches are less predictable, layout changes or cloud jitter increases, instead of relying only on a single production observation.
He warns that AI-assisted optimization is also dependent on sound measurement. If a benchmark measures the wrong thing, an agent can optimize that metric and still miss or worsen the real production problem.
A processor’s performance monitoring unit exposes many hardware and software events. Jusiak recommends inspecting available events and considering observability when selecting hardware, because the ability to understand a bottleneck affects how readily it can be improved.
He highlights data access, branch prediction and instruction delivery as important CPU bottlenecks. The right investigation depends on which part of the pipeline is constrained; an algorithm’s source code alone does not reveal every relevant hardware effect.
Profiling tools and their tradeoffs
Top-down analysis, sampling, probes, tracing and simulation expose different aspects of a workload. Each has limits or overhead.
Jusiak recommends beginning with top-down microarchitecture analysis. It categorizes pipeline activity into retiring, bad speculation, front-end bound and back-end bound, then permits deeper investigation—for example, into memory and cache misses.
The top-down categories sum to the processor pipeline’s measured slots and provide a structured starting point. A back-end-bound result, for example, can lead to a deeper look at memory and cache events rather than a premature source-code rewrite.
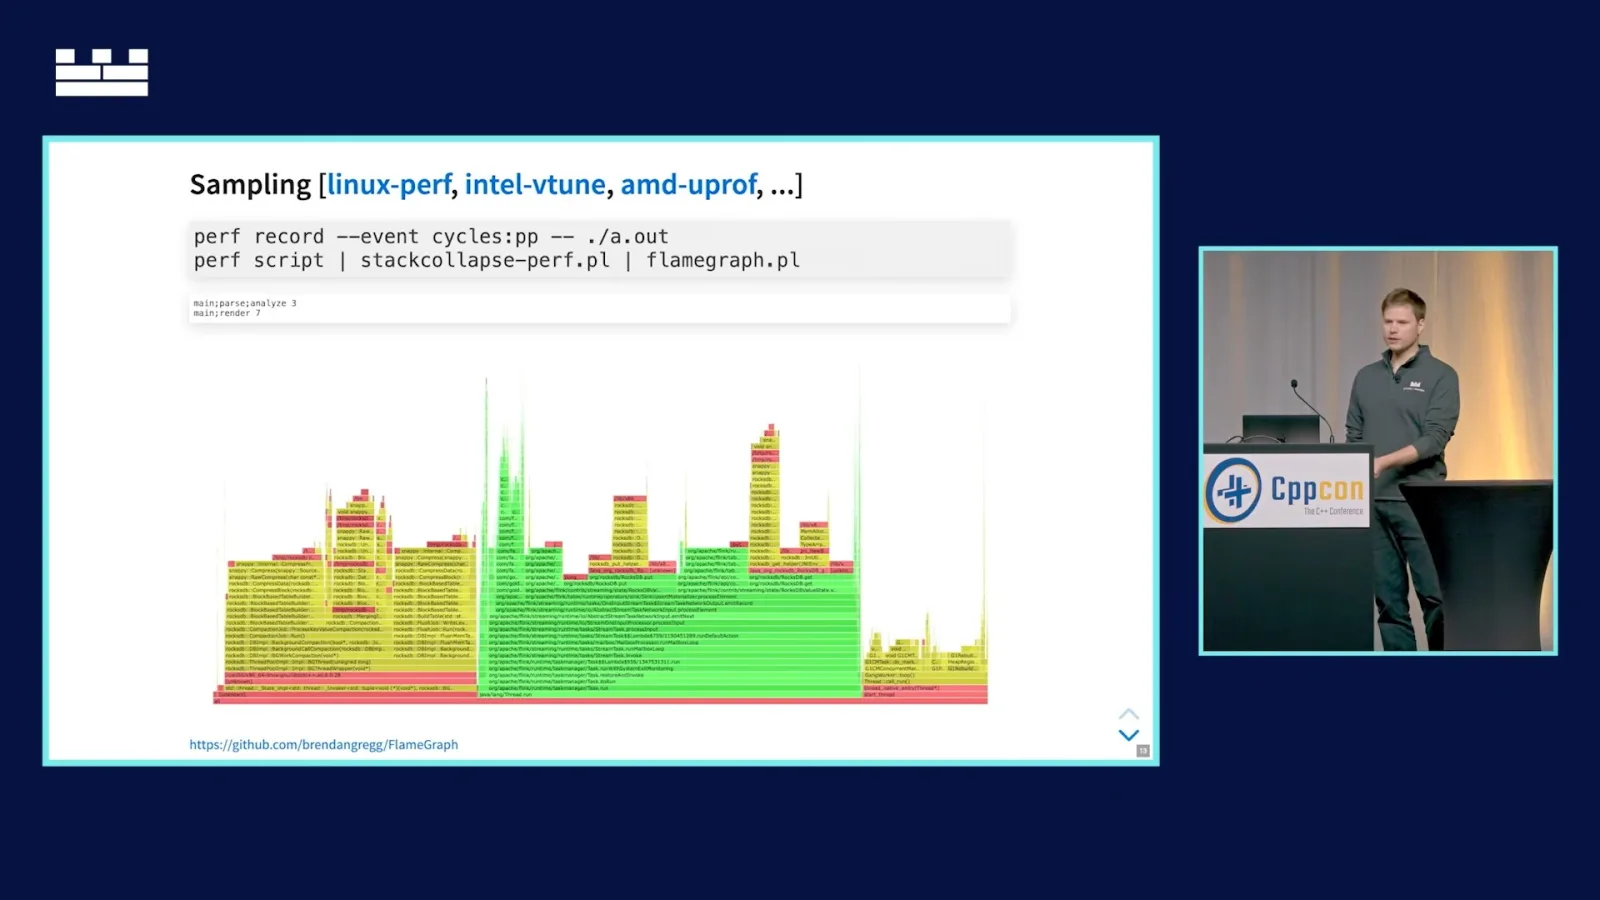
Sampling and flame graphs can reveal where time is spent, but a sampling profiler can overrepresent an idle loop and miss a rare, important message in a trading system. The right tool depends on whether the target is the common path or a tail event.
Instrumentation and eBPF probes can expose latency distributions and tail behavior without necessarily changing application source, but they still have overhead. Jusiak notes that probe interrupts and transitions can affect what is measured.
He describes compiler-supported XRay instrumentation as another option: entry and exit sites can be patched to enable selected instrumentation. The ability to choose functions can make targeted observation more practical than leaving every hook active.
Hardware processor tracing can record execution flow without ordinary statistical sampling. Jusiak says branch information can be used to reconstruct calls and approximate timing, although it can generate substantial data and the timing is not perfect at every instruction.
Processor trace records enough control-flow information to reconstruct the executed path. Jusiak says the resulting view can help examine unusual events, while noting both data volume and limitations in timing accuracy.
Tracing around a selected event can help explain what happened just before a latency spike. Jusiak cites snapshot-based tooling as an example and argues that tracing is underused for this kind of investigation.
LLVM machine-code analysis simulates execution using a model related to compiler scheduling and can show resource pressure. He warns that the simulation omits some real behavior, including front-end effects, so it should not be treated as a faithful production measurement.
Full simulation tools can provide detailed measurements for small snippets, but running a whole application under simulation is slow. Instrumenting only a region can focus analysis, although the surrounding application still runs under the simulator’s overhead.
These tools answer different questions: a flame graph summarizes sampled frequency, instrumentation observes selected points, and tracing reconstructs control flow. Their overhead and coverage differ, so no one view replaces a workload-specific question.
Why a microbenchmark can optimize the wrong thing
Tight loops can measure throughput under unrealistically favorable branch and cache conditions. Jusiak proposes exploring execution paths and hardware states.
A conventional benchmark often repeats an operation in a loop and times it. Jusiak says that can measure throughput—the rate at which the CPU overlaps repeated operations—rather than the latency of one call in a real application.
He distinguishes throughput-heavy workloads from paths where a single lookup or operation’s latency matters. He also warns that optimizing compilers can transform or remove benchmarked work, making inspection of generated assembly essential.
A benchmark that keeps data in L1 cache and branches predictable may be measuring a best case that production rarely encounters. If engineers optimize that case alone, the result may improve or regress in production for reasons they did not understand.
The same source code can behave differently because of cache accesses, branch prediction, code layout and alignment. An unused function can shift a loop across an instruction-cache boundary even if the function itself is never called.
On x86, instruction lengths can vary, and a small layout change can alter boundaries and instruction delivery. Jusiak uses this to show why a seemingly unrelated source change can affect the machine-level execution environment.
Jusiak illustrates modern CPU complexity with a processor diagram: instructions become micro-operations and pass through buffers, queues and execution resources. Operating-system activity adds noise, which must also be controlled when investigating small differences.
His proposed solution benchmarks the original machine-code region under multiple conditions. The goals include nonintrusive analysis of a production binary, exploration of relevant paths, controlled cache and branch states, and statistically defensible comparisons.
He emphasizes that performance is a distribution rather than a single number. Statistical comparisons need assumptions suited to the measurements; his demonstration seeks controlled distributions, but normality is not a universal prerequisite for every valid statistical method.
From machine code to symbolic paths and inputs
The demonstrated approach analyzes machine code, solves path constraints and prepares a native harness. Branch-predictor and cache state must be controlled separately.
Starting from machine code makes the analysis language-agnostic. Symbolic exploration identifies possible paths, memory accesses and constraints; a separate harness prepares inputs and measures native execution rather than relying solely on simulation.
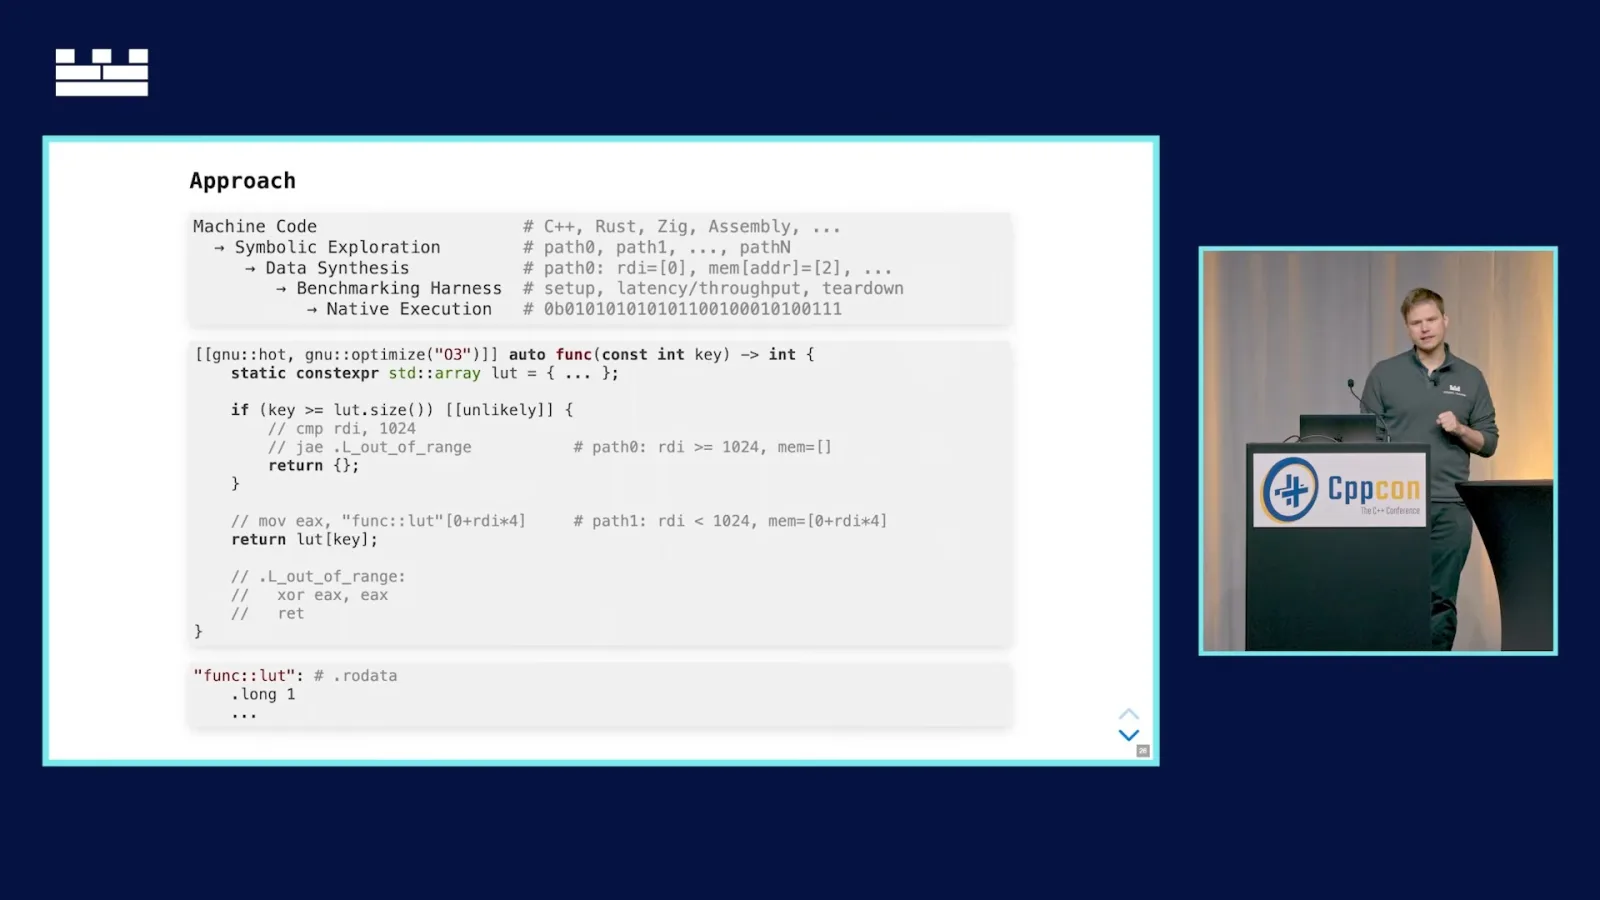
A constant lookup table illustrates why setup can be difficult: data may be embedded in read-only memory, and different inputs may or may not reach it. To test cache behavior, the harness needs to know which addresses the code actually accesses.
One path through the example can use a lookup table while another does not. The benchmark needs to account for both the inputs that select each path and the memory location read by the table-using path.
Jusiak describes using VEX intermediate representation, symbolic-analysis tooling and Unicorn emulation to explore paths. He uses a FizzBuzz-style function with several conditions and a global value to illustrate how source branches and generated instructions need not correspond one-to-one.
The exploration starts from a symbolic state and looks for paths to a target address. It records conditions on registers and memory, as well as dead ends. He warns that the number of states can explode for large programs, so practical analysis requires constraints.
The symbolic solution includes the instruction position, register and memory constraints. Solving those constraints produces concrete values that can drive a desired path during native measurements.
For the example, the analysis finds several paths, including one that reads memory. A solver then produces concrete inputs satisfying path constraints. Those inputs can be used to drive the benchmark down particular paths and identify memory locations whose cache state matters.
Branch predictors maintain complex history, making an exact target state difficult to set. Jusiak’s practical approach is to feed sequences of suitable inputs so the predictor encounters the pattern being tested, then verify the effect with measurement.
He discusses how initial branch history and branch-target-buffer behavior can affect rare paths. A branch that is almost never taken can behave differently when it finally is; such a case may matter disproportionately for tail latency.
He notes that branch predictor behavior depends on history, so a single random-looking input is not equivalent to a representative sequence. The harness prepares a distribution of inputs and measures the resulting behavior.
Using the symbolic inputs, the harness can generate predictable or less predictable branch patterns. In one processor-specific example, Jusiak shows a misprediction cost of roughly 14 cycles; that number should not be generalized to every processor or branch.
He recommends empirical cumulative distribution function plots because they show percentiles and the tail of the observed results. A single average can hide a rare slow path even when most measurements look good.
Cache placement is the next challenge. Symbolic exploration identifies reads and writes, but the harness must arrange the corresponding data in memory and influence which cache level holds each line before measuring.
For L1, loading data can warm a line; prefetch is only a hint and may require settling time. Jusiak stresses that these mechanisms and their effects are hardware-specific and must be measured, not assumed from an instruction name alone.
He describes flushing a line and using a prefetch hint to study an L2-resident case. His observations concern the CPUs he tested; prefetch instructions do not provide a universal guarantee that a line will land in a particular level.
For one Intel platform he demonstrates using CLDEMOTE as part of an L3 setup, and uses a flush to explore a memory-resident case. He notes that L3 control is harder on other architectures, so the recipe is not portable without verification.
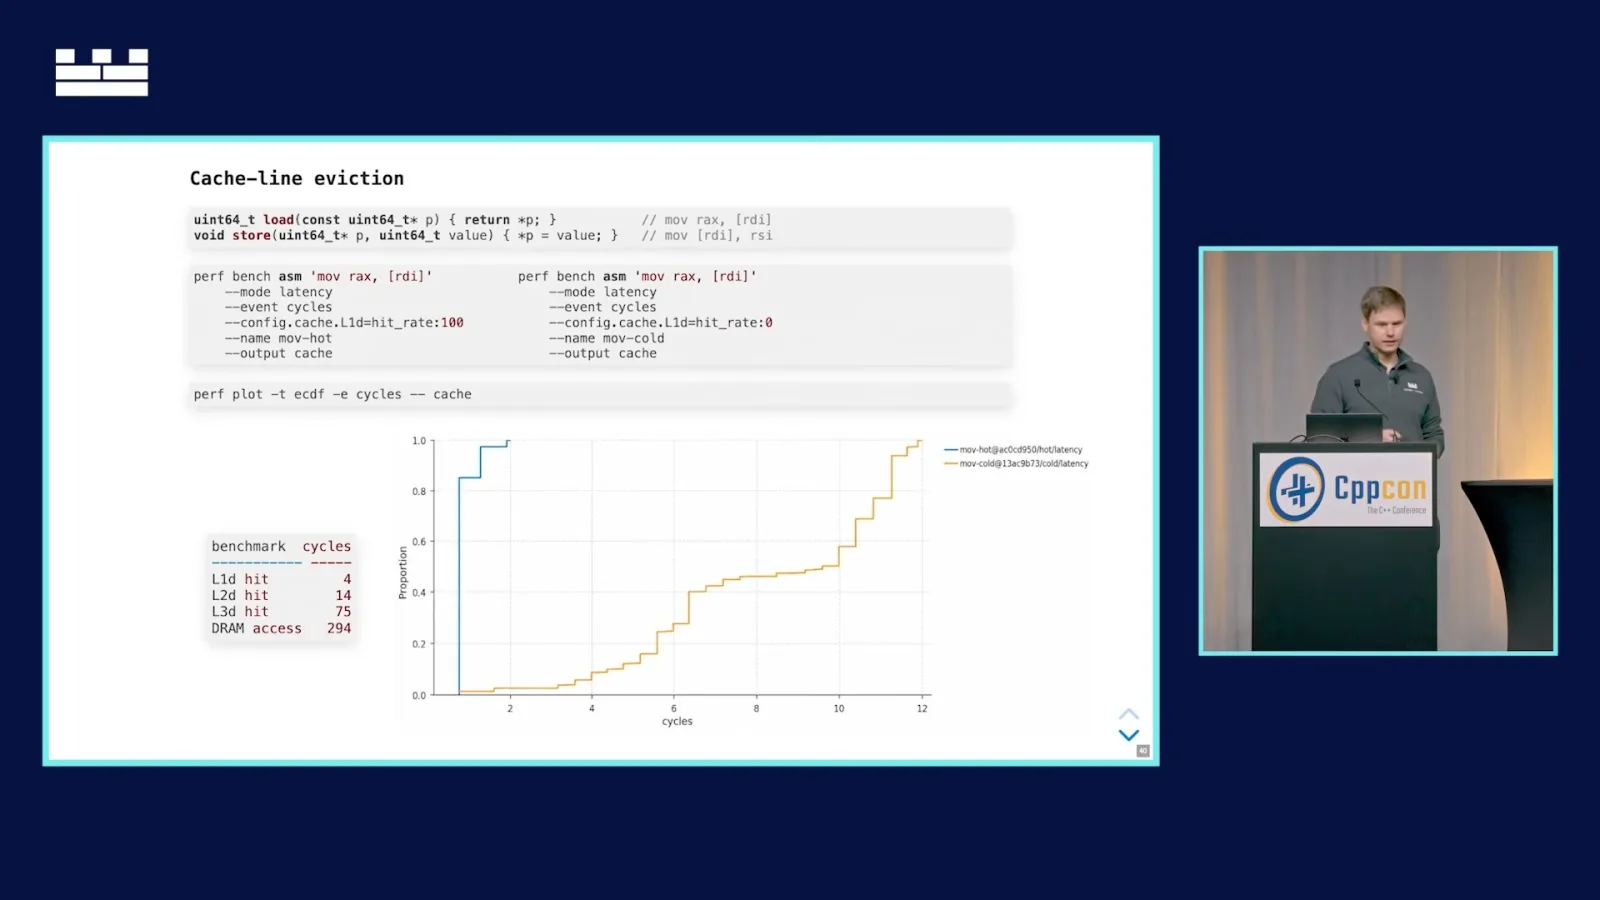
A harness can prepare ranges of addresses according to chosen cache-hit distributions rather than doing one isolated line at a time. Jusiak illustrates how a hierarchy of L1, L2, L3 and memory hit rates creates different hot and cold paths.
The example cache hierarchy applies conditional hit rates at successive levels: a miss at one level proceeds to the next. Jusiak uses it to reason about how a mixture of hot and cold accesses affects a full latency distribution.
He compares a simple memory access under different cache conditions and shows that even L1 versus L2 changes the distribution. Going to main memory can have a larger effect. The point is to measure the state relevant to the workload, not assume all accesses are warm.
Native execution and benchmark scenarios
Jusiak discusses latency versus throughput, hardware setup, noise and measuring realistic as well as adverse distributions.
Cache and branch state are not the entire setup: alignment, instruction cache, translation lookaside buffers, execution ports, CPU affinity and priority can matter. Testing every combination can be expensive, so the engineer must choose scenarios deliberately.
Jusiak also mentions that testing an isolated function can differ from testing code inlined into several callers. Surrounding instructions and compiler optimization may produce different machine-code regions, which need separate consideration.
Native measurement requires a harness around the selected binary region, with care for calling conventions, state and counters. Jusiak notes that inlining changes the machine code surrounding a function, so a standalone benchmark may not represent every inlined use.
He returns to latency and throughput. A repeated benchmark can show better per-operation throughput through overlapping execution, while a single dependent operation exposes latency. Reporting inverse throughput in time per operation can help compare units, but the two still measure different behavior.
For tiny instruction sequences he describes an unrolling-and-subtraction method used in instruction benchmarking. The technique has constraints, including control-flow effects, and is useful only when the measurement harness and assumptions are understood.
Before benchmarking, inspect the actual CPU topology, family, model and stepping. Compiler scheduling models and published instruction measurements can offer useful cross-checks, but the target machine remains the system being measured.
CPU identification helps select relevant performance events and interpret the results. Jusiak points to topology tools and compiler scheduling descriptions as sources of context, not replacements for measuring the actual workload.
Jusiak argues for controlling measurement noise rather than accepting it as an unexplained property. He suggests inspecting timing distributions on a tuned machine, then deliberately introducing the disturbances relevant to the workload.
Sanity-check simple instruction measurements against established references before trusting a more complex setup. Agreement does not prove every later result is correct, but a mismatch can reveal a problem in the measurement machinery.
He compares a best case with warm caches and predictable branches, an observed distribution, and adverse cases such as poor alignment or accesses to main memory. The right worst case depends on the application; the aim is to understand the range before it occurs.
To approximate actual behavior, Jusiak describes collecting production inputs with probes and debug information, and sampling branch or cache behavior. Those observations can inform a benchmark distribution, supplemented with scenarios the production sample has not yet encountered.
Debug symbols can help recover the structure of captured function arguments. The resulting input sample describes what was observed; additional chosen distributions are needed to ask about conditions that have not occurred yet.
The approach combines discovered machine-code paths and addresses with observed or chosen distributions, then runs the benchmark natively. Exploring an entire binary can be prohibitively expensive, so he recommends narrowing the scope to relevant functions or regions.
Distributions, code layout and the measurement cycle
Case studies examine input-dependent paths and alignment. Jusiak recommends repeated profiling, benchmarking and statistical comparison, then answers questions about production data.
In a simple example, different input values take different instruction paths. Jusiak says large error bars can represent real variation in branch behavior across the selected scenarios rather than merely measurement noise.
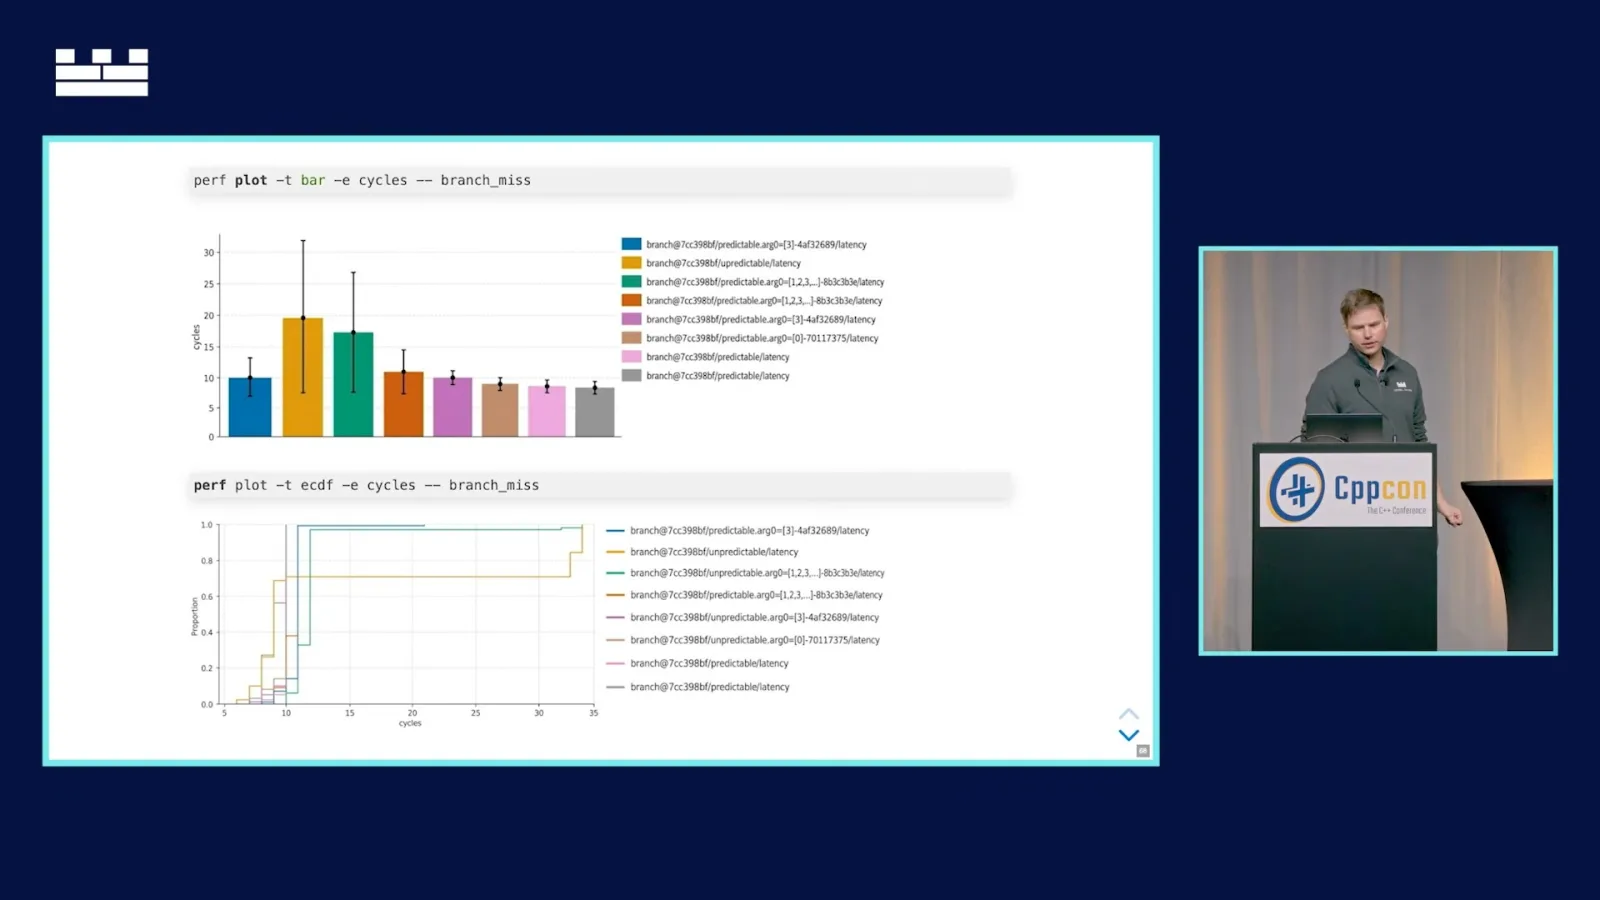
He recommends comparing empirical distributions to see where one case’s tail diverges from another. Engineers can then investigate specific percentiles and apply statistical analysis appropriate to the data and question.
In the branch example, one input distribution has a different prediction pattern and a different tail from another. The distribution plot makes that contrast easier to see than a single aggregate value.
Code alignment creates another source of surprise: adding or removing unrelated code, changing a compiler or changing layout can move a hot loop across boundaries. Instruction-cache effects mean even unused code can indirectly change performance.
He demonstrates applying the same style of controlled benchmark to library code, varying cache and branch conditions. A benchmark that assumes a cache line can never be evicted may look excellent but can miss the conditions that matter later.
The recurring cycle is profile, benchmark, analyze and optimize, then repeat. Jusiak advocates plotting distributions and using a statistical comparison rather than choosing an implementation because a single displayed number is smaller.
Jusiak distinguishes a visually appealing chart from evidence that two implementations differ reliably. He advocates a statistical comparison while remaining clear about measurement assumptions and the scope of the experiment.
He suggests that once measurement and analysis are reliable, more of the loop might be automated, including with AI. He presents that as a future workflow dependent on trustworthy benchmarking, not a substitute for it.
An audience member asks whether the tool synthesizes a new program. Jusiak clarifies that it analyzes and executes the original machine code in a harness, while synthesizing inputs and cache or eviction conditions around it.
Another attendee asks how to measure production without disrupting it. Jusiak recommends limited production metrics and, when necessary, targeted tracing or instrumentation; then investigate observed and hypothetical conditions on an isolated test machine.
More from this channel
 1:01:02EN
 Citadel Securities· Oct 27, 2026Podcast · 3 speakersSequoia's Alfred Lin and Konstantine Buhler on AI, Investment and the Agent EconomyGuest Alfred Lin, Konstantine Buhler · Host Nohshad ShahAt Citadel Securities' 2026 conference, the partners discuss their investment process, model competition, computing constraints and future opportunities.
 18:55ENCitadel Securities· Oct 26, 2026Podcast · 4 speakersJeff Maurone on Citadel Securities’ Market Analytics and TechnologyThe technology COO describes tools for market positioning, credit spreads and client questions, and the research infrastructure behind them.
 44:58ENCitadel Securities· Oct 26, 2026Podcast · 2 speakersMario Draghi on Europe’s Growth, Energy and Security ChoicesGuest Mario Draghi · Host Lisa AbramowiczIn an October 2026 conversation with Lisa Abramowicz, the former ECB president discusses fiscal pressures, AI, energy and European integration.
 45:34ENCitadel Securities· Oct 26, 2026Podcast · 2 speakersHenry Paulson on AI Risk, U.S.–China Relations and Crisis LeadershipGuest Henry M. Paulson, Jr. · Host Jim EspositoThe former Treasury secretary discusses today’s economic risks and lessons from the 2008 financial crisis.
 1:01:23ENCitadel SecuritiesPodcastJensen Huang on AI Factories, Digital Workers and Why the Build-Out Has Barely BegunNvidia's CEO tells a room of institutional investors how accelerated computing led to AI factories, and where agentic AI, robotics and sovereign AI go next.