In 30 seconds
Matthew Berman reviews Gemini 3.8 Flash using a benchmark and pricing table, then shows his team's tests of 3D scenes, product pages, a presentation, a terrain map and a simple game. He finds the model competitive for its price but inconsistent across tasks. The video also covers a restricted cybersecurity variant; benchmark scores and prices are the figures presented at the time and depend on methodology and rollout terms.
- 1Mixed benchmark resultsThe displayed table reports 73.7% on DeepSWE v1.1 and lower relative results on some other evaluations. Benchmarks test different tasks and are not interchangeable.
- 2Introductory versus regular pricingThe video shows $0.75 per million input tokens and $3.75 per million output tokens as introductory rates, with $1.50 and $7.50 listed as regular rates.
- 3A table-reading correctionBerman attributes 61.4% to Harvey's legal benchmark, but the on-screen table associates that figure with Vals Finance Agent v2 and shows 10.0% for Harvey's benchmark.
- 4Cost per taskA lower token price does not necessarily mean a lower task cost if the model uses more tokens to reach a result.
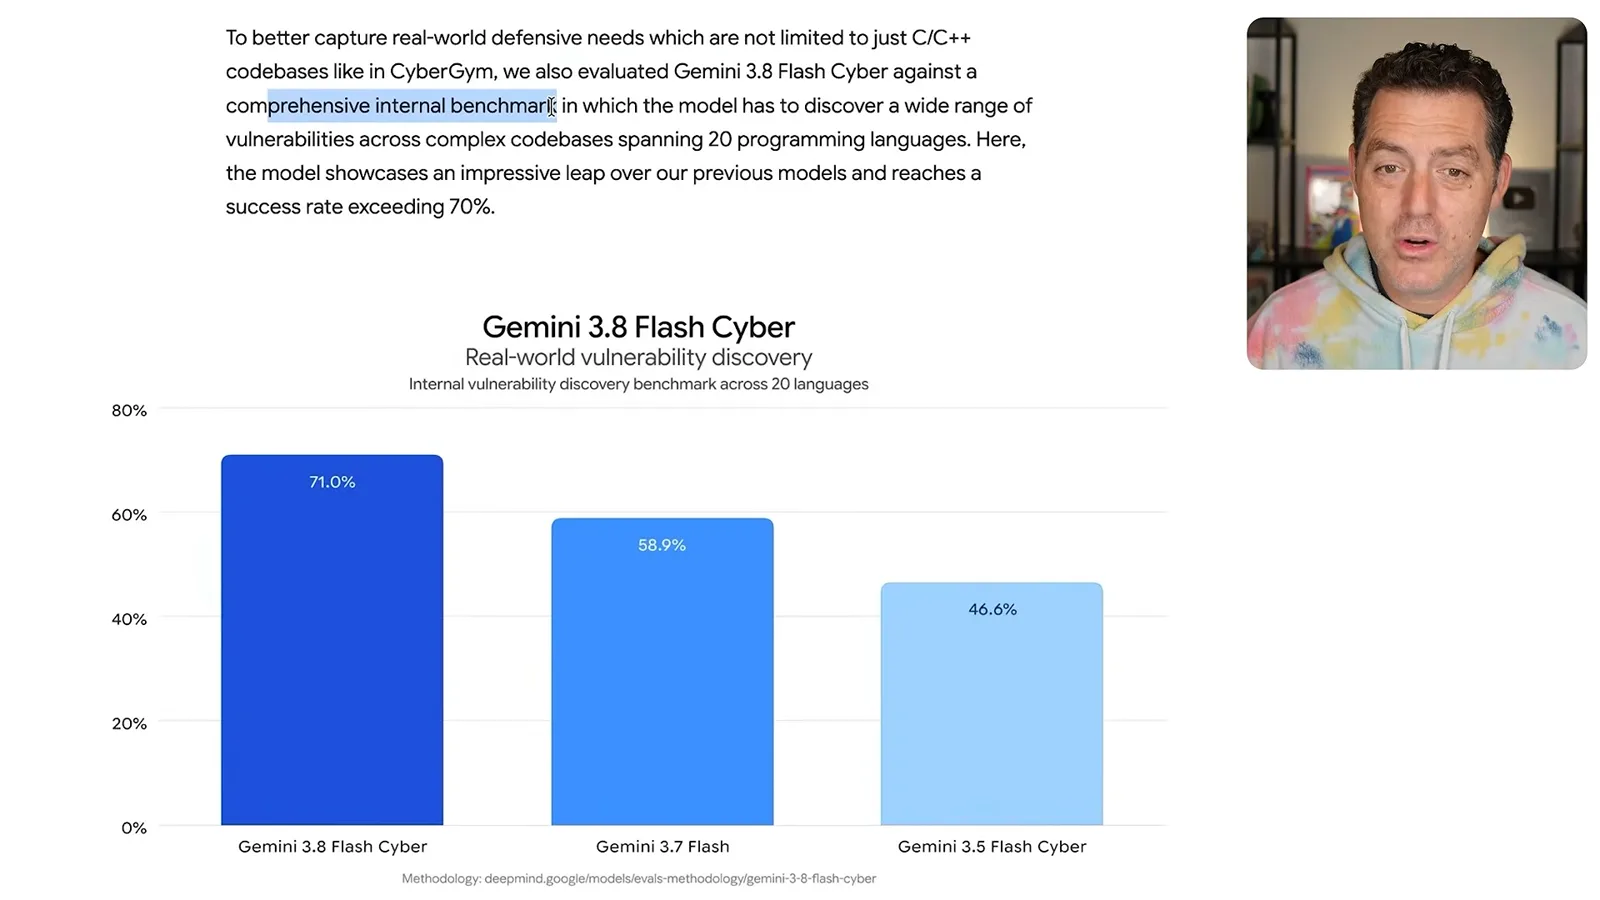
- 5Cybersecurity variantBerman describes restricted access and Google's internal vulnerability-discovery test; the comparison shown includes Google's own models.
- 6Hands-on results vary3D scenes and an interactive terrain map impress him, while several product pages and a presentation have design shortcomings.
Takeaways
- Berman values the combination of software-engineering benchmark performance and low introductory token prices, while acknowledging mixed results elsewhere.
- Cost per completed task depends on token consumption as well as the price per token.
- The video's table assigns 61.4% to a finance benchmark and 10.0% to Harvey's legal benchmark; the narration conflates them.
- The cybersecurity variant's internal evaluation compares Google models and does not establish superiority over all competitors.
- His creative tests produce both useful interfaces and visible design or rendering errors; organizations should evaluate their own tasks.
Read the edited text by chapter
Positioning Gemini 3.8 Flash
Berman gives his assessment of Google's recent models and introduces the new model's price and performance.
Matthew Berman reviews Google's Gemini 3.8 Flash shortly after its September 2026 release. His assessment is that the model is useful and competitive on cost, although performance varies across benchmarks and hands-on tasks. His comparisons and prices reflect the time of this video.
Benchmarks and pricing
He compares coding, knowledge-work and agent evaluations, noting that introductory rates differ from regular pricing.
Berman begins with DeepSWE v1.1, a long-horizon software-engineering benchmark he considers meaningful. The table in the video reports 73.7% for Gemini 3.8 Flash, near the listed 74.0% for Claude Opus 5. He contrasts that with a lower relative GDPVal-AA score for knowledge work. Different benchmarks and evaluation setups measure different capabilities.
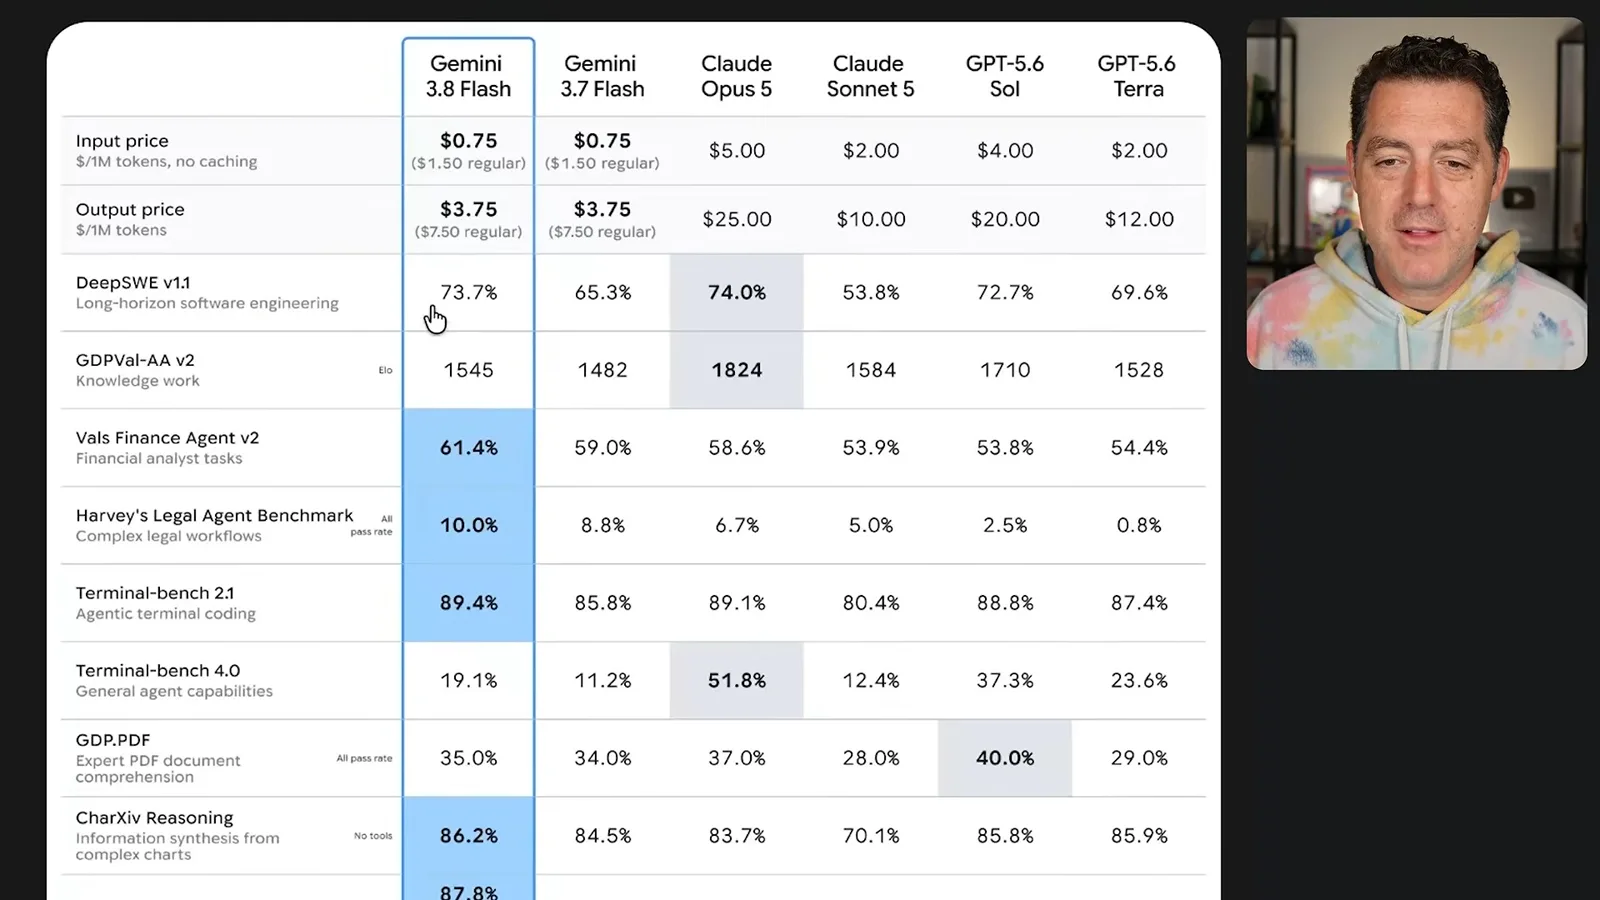
The displayed introductory prices are $0.75 per million input tokens and $3.75 per million output tokens. Berman points out that the table also lists regular prices of $1.50 and $7.50, and says the introductory rates were set to expire at the end of 2026. He criticizes the presentation of temporary prices as more prominent than the regular rates.
Berman discusses legal and financial benchmarks and recommends that organizations build their own evaluations around actual tasks. His narration attributes 61.4% to Harvey's legal benchmark, but the displayed table places 61.4% on Vals Finance Agent v2 and lists 10.0% for Harvey's Legal Agent Benchmark. Neither score alone establishes suitability for legal or financial decisions.
The table shows 89.4% on Terminal-Bench 2.1 but 19.1% on Terminal-Bench 4.0, which Berman describes as a newer, harder evaluation. He also discusses scores for Humanity's Last Exam and OSWorld. His main observation is unevenness: strong performance on one test need not carry over to another.
Cost efficiency and cybersecurity
He considers cost per task and a restricted cyber variant, including a Google internal evaluation.
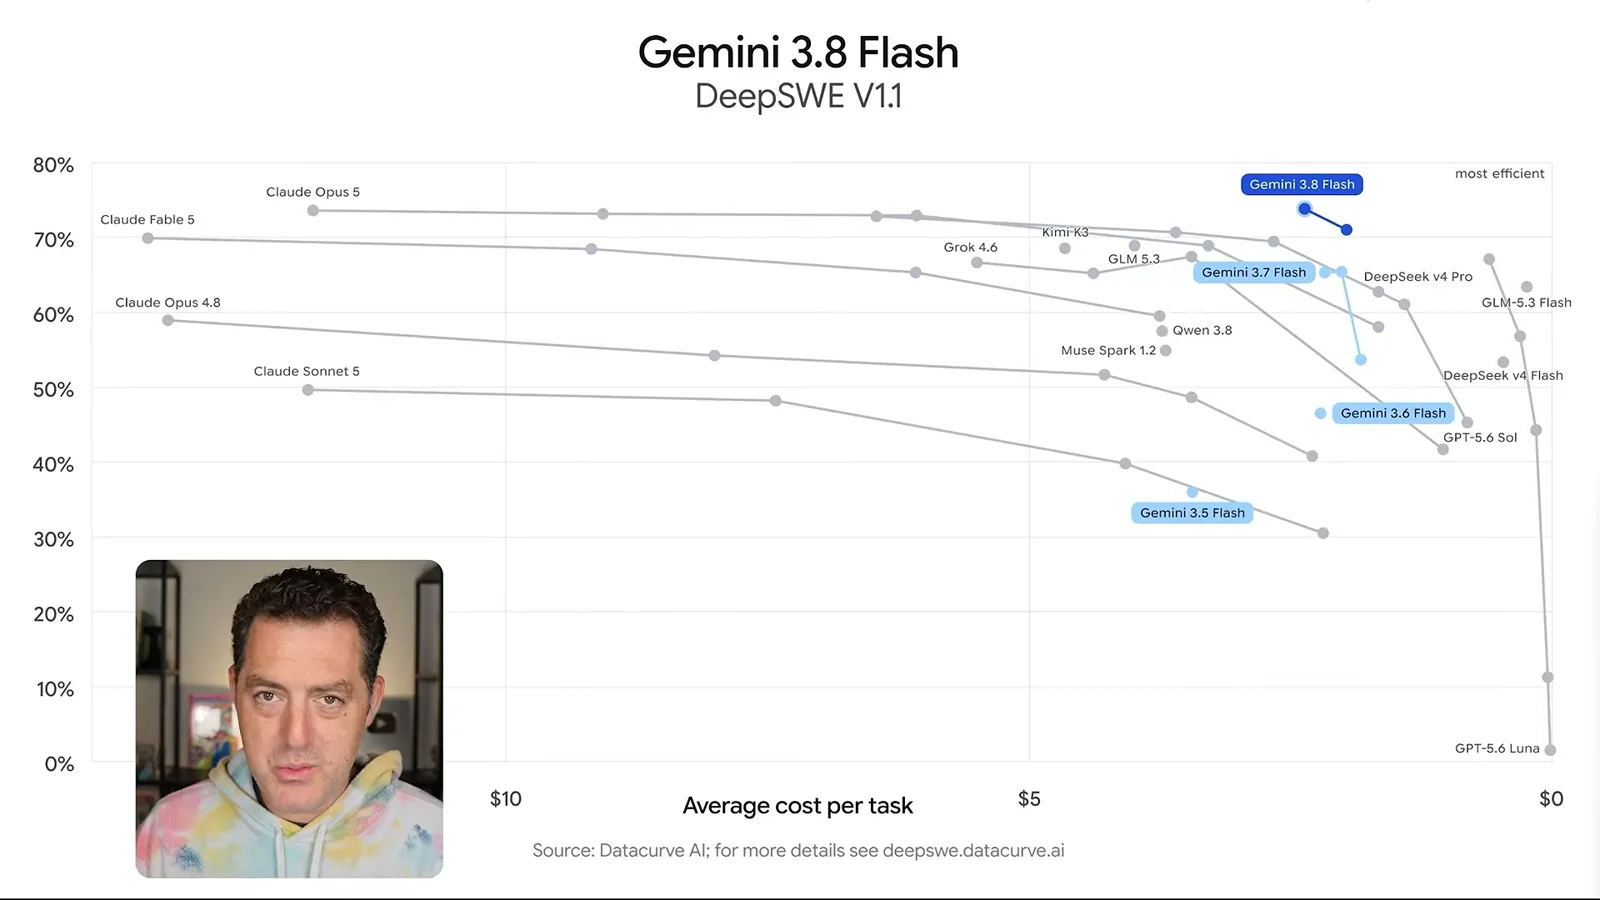
A DeepSWE chart compares performance with average cost per task. Berman emphasizes that token price is only part of the calculation: a cheaper model that consumes more tokens may cost as much to complete a task. The chart reflects the evaluation's workload and settings, not a universal price ranking.
Google also announced Gemini 3.8 Flash Cyber, which Berman describes as a cybersecurity-focused variant available to approved defenders through a restricted program. He cites CyberGym results and explains that Google also tested vulnerability discovery across 20 languages on an internal benchmark.
The internal chart compares the new cyber variant with earlier Google models, not with competing companies' models. Berman treats the improvement as notable, but an internal benchmark and restricted access limit what an outside reader can infer about performance in a particular security environment.
3D scenes and product websites
Berman compares generated visual scenes and checks several interactive product pages.
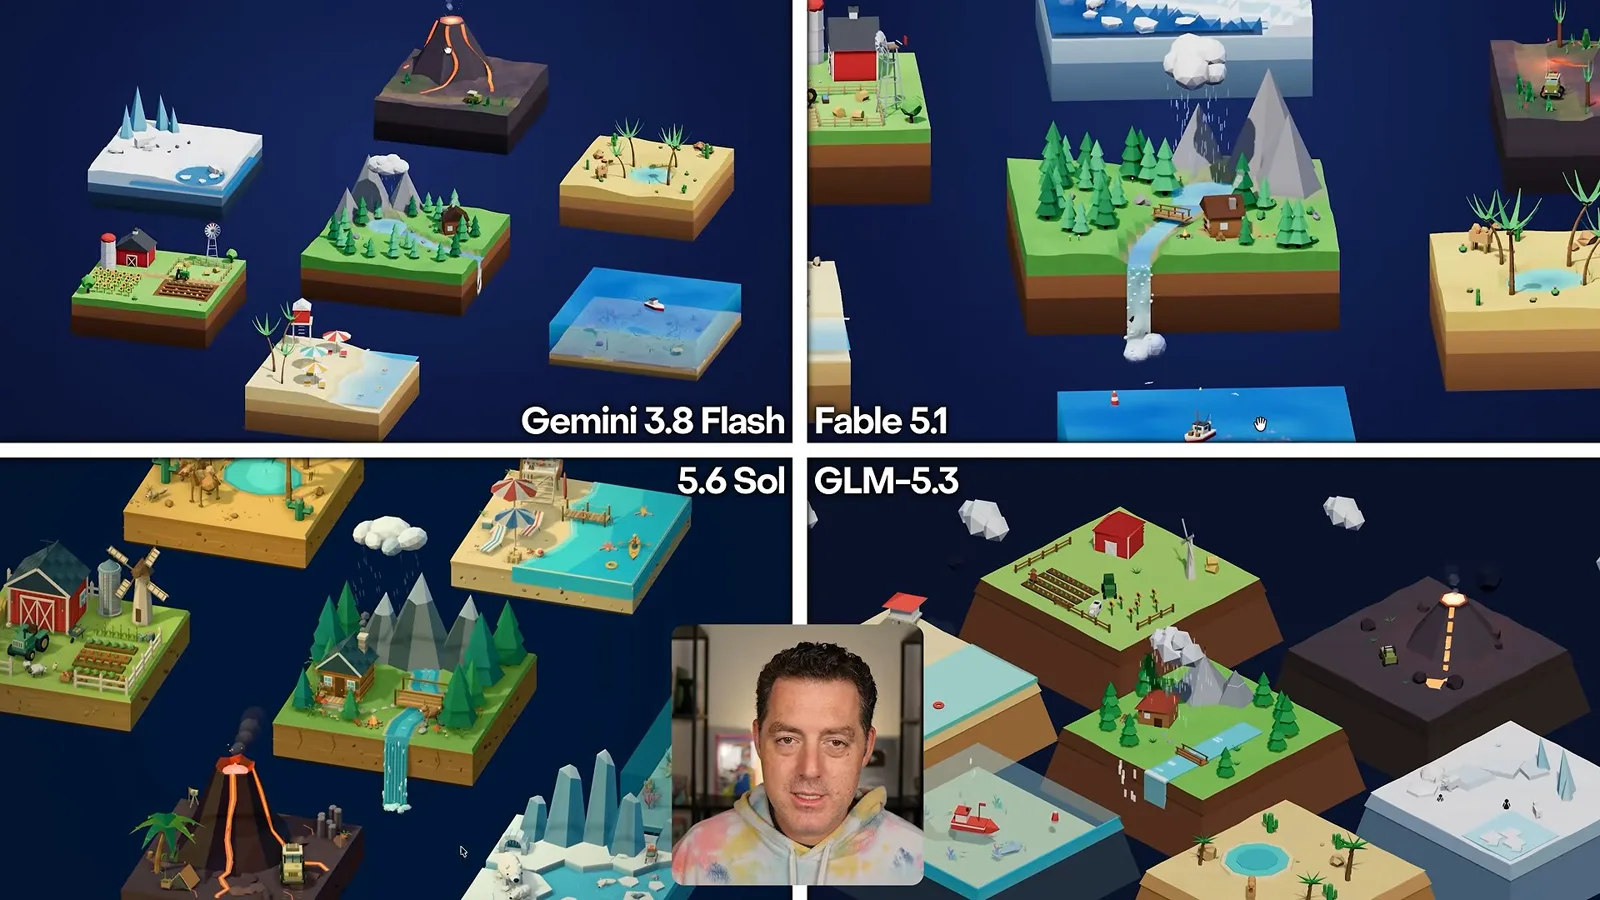
For a practical test, Berman asks the model to create seven low-poly 3D biomes and compares them with output from other models. He likes the beach and farm but finds less detail than in his preferred comparison and spots rendering problems, including water extending outside an icy scene.
The next test generates product websites. An apple-store page is too simple for his taste and has a confusing checkout. A page for a computing product looks better and includes interactive values, though he notices clipping. These are subjective comparisons of the specific outputs shown.
A rubber-duck page disappoints him, and a foldable-phone page has an interactive hinge but an unconvincing phone rendering. A Model Y configurator also draws the car poorly, yet lets him change options and includes an animation he likes. He rates the overall website results around or below one comparison model.
Presentation, terrain map and game
A slide deck, an interactive Everest visualization and a simple game round out the practical tests.
Berman then reviews a generated presentation about data centers. It uses his Forward Future branding and has a reasonable structure, but he finds the visual design modest and says he would choose another model when presentation design is especially important. He does not perform a detailed fact check of the deck.
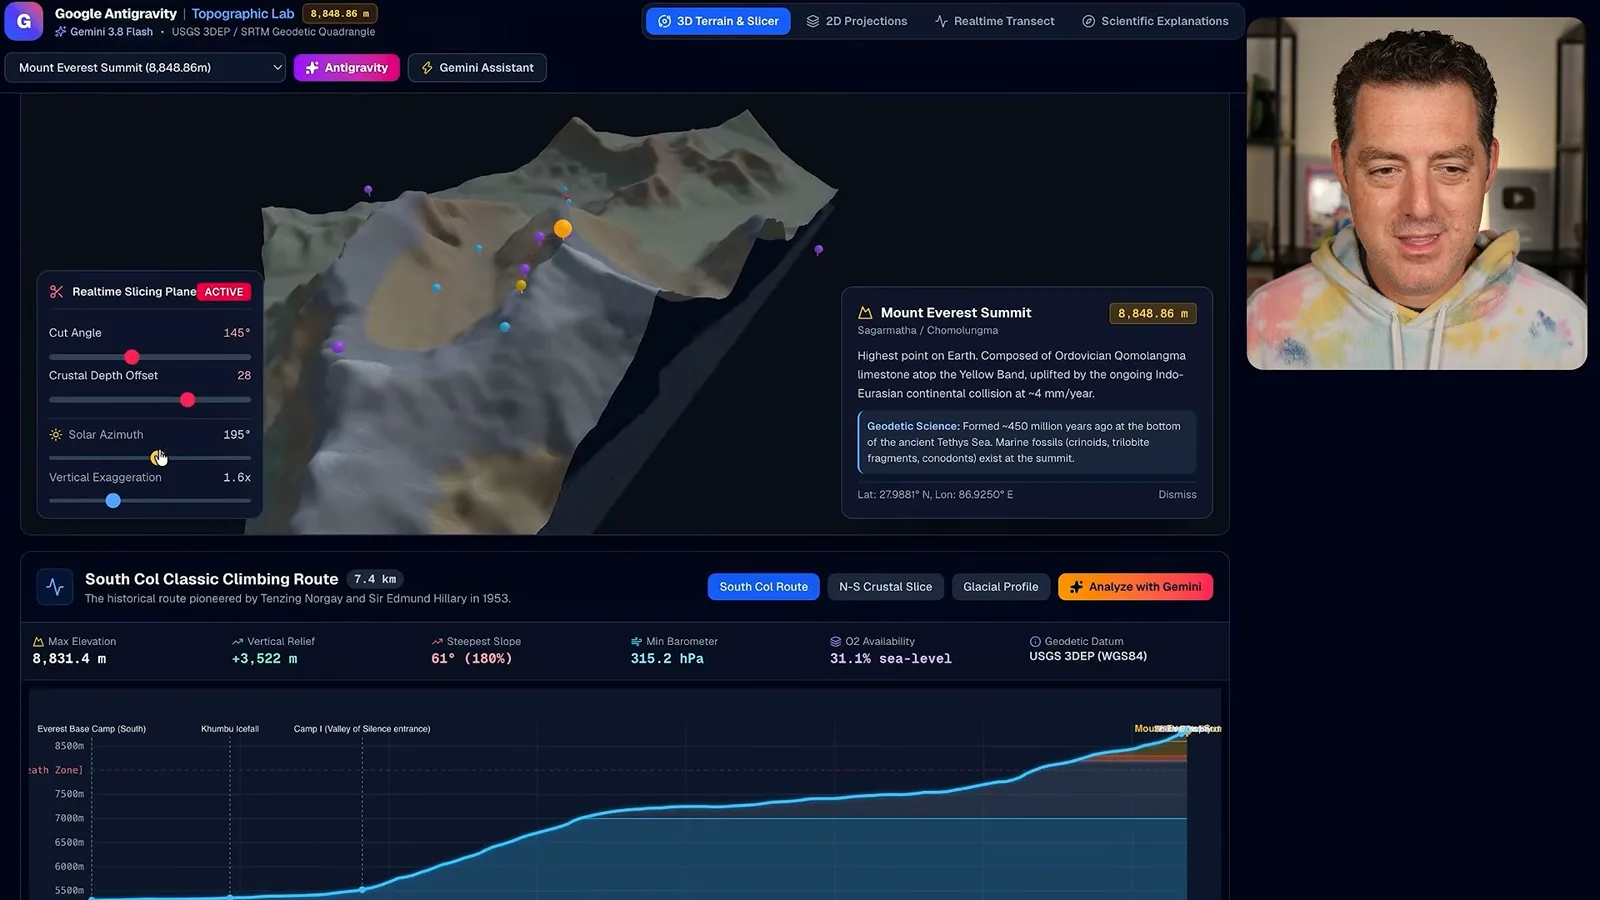
A teammate's interactive Everest terrain map impresses him more. He rotates and zooms the terrain, changes the cut angle and vertical exaggeration, and explores marked locations and a two-dimensional view. He notes that he has no equivalent test output to compare against it.
A simple Doom-like game generated from a prompt is playable, though basic. Berman concludes that the model is not the strongest on every task but is competitive for its price, and encourages testing outputs for the intended use rather than relying on a single headline benchmark.
More from this channel
 25:50EN
 32:20EN
 45:08EN
 0:32EN
 12:14EN
 10:36EN