30 秒でわかる
A managed incident investigator needs three pieces: an agent definition for its model and tools, an environment in which those tools run, and a session that joins them to a conversation and data. Anthropic engineer Isabella He demonstrates a Streamlit app that streams tool calls and findings while investigating simulated checkout latency. Its tools inspect metrics, recent deployments and code differences; in the demo it identifies an exhausted database pool and recommends actions. She also explains why Managed Agents separates its server-side agent loop from tool execution, and how persistent event logs support resuming a session.
- 1An agent, an environment and a session have different jobsThe agent defines the model, prompt and capabilities; the environment supplies execution infrastructure and guardrails; a session combines them with a conversation.
- 2The agent loop and tool execution run separatelyHe says separating the server-side loop from on-demand execution helps with isolation and reliability. She reports more than a 90% reduction in the 95th-percentile time to first token from the design change.
- 3An incident investigator needs its own tools and contextThe workshop defines an SRE agent, supplies a log file, and connects tools for metrics, recent deployments and code differences.
- 4Sessions stream events, not just a final answerMessages, responses and tool calls are recorded as events. Users can see work as it happens, and the same record supports observability and resumption.
- 5The demo identifies a database pool exhausted by a queryAfter a retry, the agent reports a likely cause, rules out alternatives and recommends actions. The workshop stops before implementing an automatic fix.
- 6A failed tool container need not restart the whole agent loopHe says the persisted event-based session can resume, while a tool container can be restarted separately. Session states also support retries and external triggers.
- 7Memory, subagents and outcome rubrics extend the basic exampleHe outlines additional features for delegation, retaining context, evaluating desired results and protecting credentials in vaults.
ポイント
- Define the agent’s capabilities, execution environment and session separately; attach the data the session needs.
- An agent that can converse still needs connected tool handlers before it can retrieve metrics or deployment history.
- Stream and retain events such as messages and tool calls so users can follow work and sessions can resume.
- Restrict network access and choose where tools execute according to the environment and permissions required.
- In the simulated incident, the agent recommends a response; automatic code fixes are a possible extension, not part of the demo.
チャプターごとに整えた全文を読む
From raw model calls to a managed agent loop
He explains how the Messages API, Agent SDK and Managed Agents shift infrastructure work away from application developers. She uses a simulated incident investigator as the workshop example.
I’m Isabella He, a member of Anthropic’s Applied AI team. We work across products, research and customers: internally on tools such as Claude Code and its agent frameworks, and externally with developers building on them. The goal today is to build an incident investigator while understanding how Claude Managed Agents runs underneath it.
We’ll start with the framework’s architecture, spend most of the session building a site reliability agent in a repository, and then look beyond the basics. A later session covers dreaming and memory, which can help an agent improve over time.
When Claude’s Messages API arrived in 2023, it gave developers programmatic access to model input and output. Builders had to implement the surrounding pieces themselves, including the agent loop, context management and compaction. Those pieces became more complex as models gained the ability to use tools and carry out longer tasks.
The Agent SDK made Claude Code’s computer and file-system capabilities available through a framework, but developers still had to host, scale and safely run it in containers. Claude Managed Agents adds managed infrastructure around the framework, including sandboxing, observability and a tool runtime. The developer can concentrate on task configuration and domain-specific tools.
Frameworks also have to evolve with models. We saw Sonnet 4.5 sometimes wrap up early despite having room in its context window, a behavior we called context anxiety, and added mitigations. When Opus 4.5 no longer showed that behavior, that work became unnecessary. Managed Agents is intended to keep pieces such as context handling and caching up to date as models change.
Define the agent, environment and session
An agent definition supplies capabilities, an environment governs execution, and a session brings them together. The server-side loop is separated from tool execution.
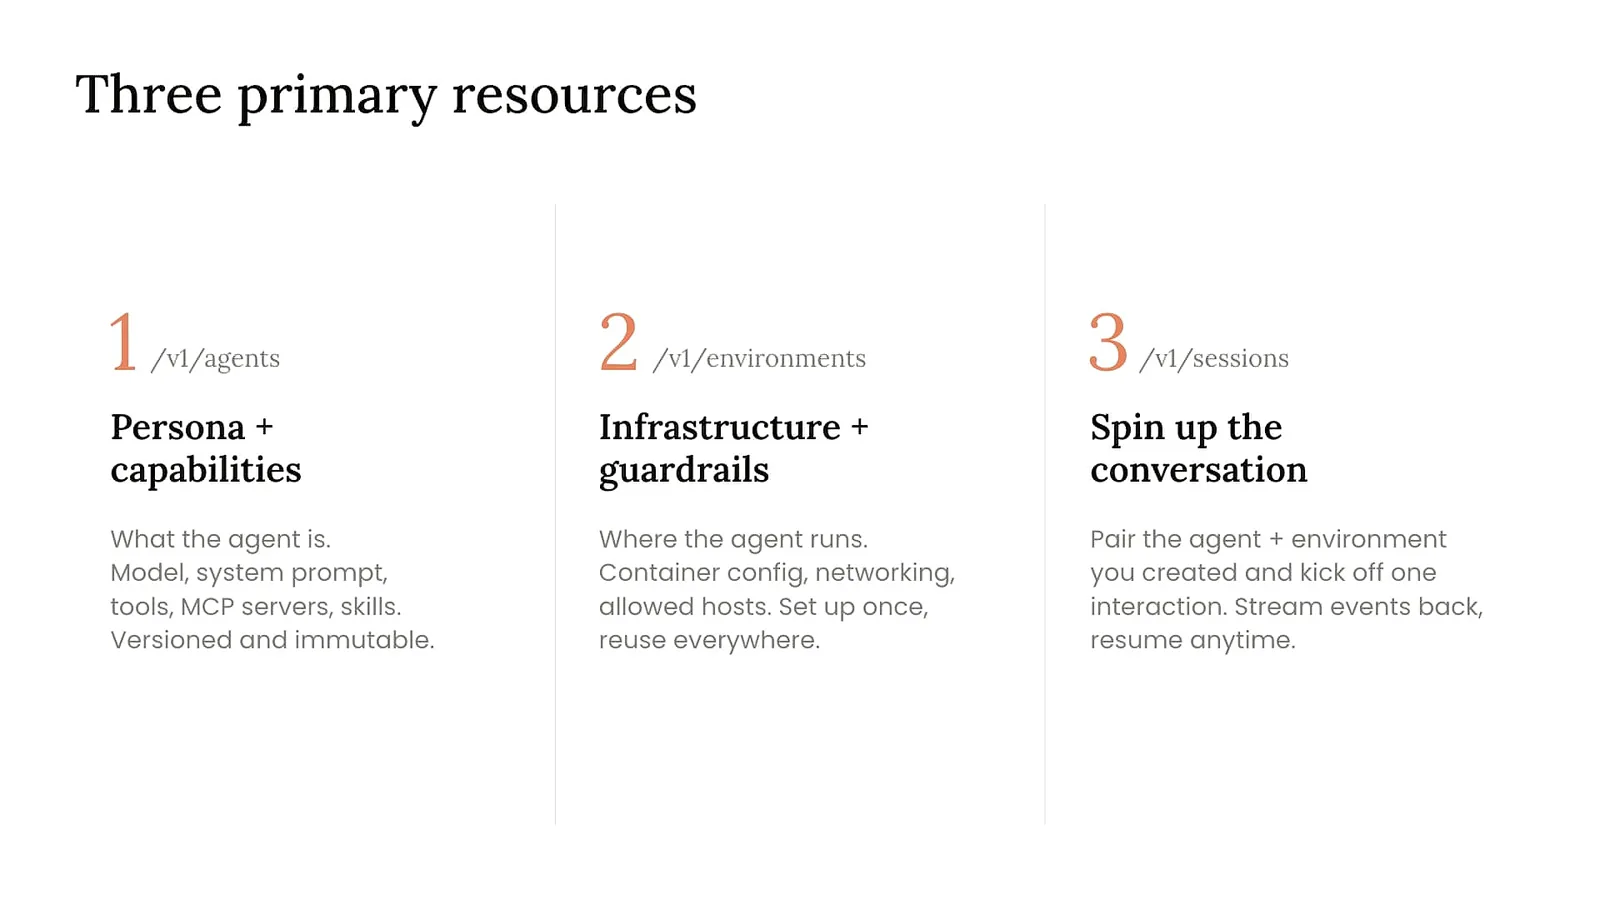
Three resources form the core. An agent definition is the persona and capabilities: the model, system prompt, tools, MCP servers and skills. An environment is where the agent can act, including its container and networking configuration. A session ties an agent instance to an environment and provides the interaction from which events can be streamed.
The agent loop runs server-side. If a user closes a laptop or refreshes the application, the session is maintained rather than depending on that browser remaining open. That separates some of the hosting, scaling and durability work from the application a developer builds.
A key design choice is separating the agent loop—the “brain”—from tool execution—the “hands.” Older designs often put both in the same container for each session. Decoupling them allows more distinct isolation around execution and credentials, and a tool container can be provisioned when it is needed.
That separation also affects latency. With the loop and execution coupled, a container had to start for every session before the work could proceed. Our teams observed a reduction of more than 90% in 95th-percentile time to first token after decoupling them. The design also lets the loop survive independently if a tool container fails.
Set up the incident-response workshop
The workshop repository provides a Streamlit app, local incident data and a completed reference. He fills in an agent definition, execution environment and log upload.
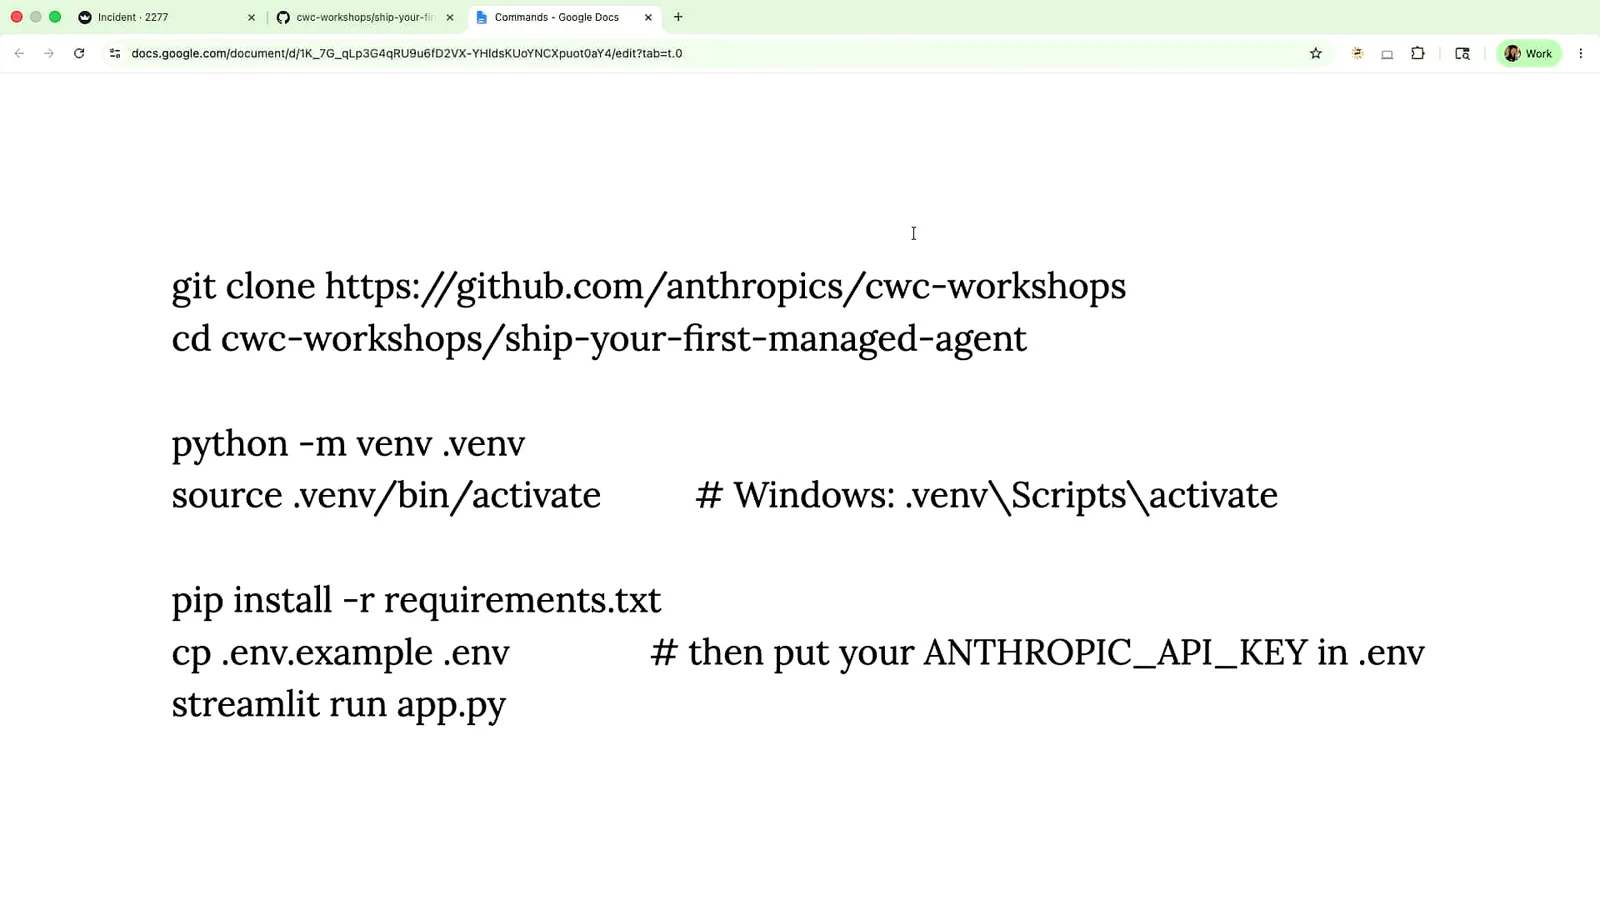
For the workshop, clone the supplied repository and open the `ship-your-first-managed-agent` directory. Set up the Python environment, install the requirements, configure the API key and run the Streamlit app. The repository includes instructions and a completed reference file, so you can follow the demonstration even without completing setup during the session.
The app simulates an incident, a familiar situation for an on-call engineer woken in the middle of the night. A person would normally inspect metrics, logs and recent deployments to understand the failure. We’ll give the agent access to the same kinds of information and ask it to investigate.
In the code, we’ll copy pieces from the completed reference into an incomplete `agent.py` so we can see how the components fit together. First is the agent definition: in this example it uses Claude Opus 4.7, a system prompt and a set of tools. Creating it gives us an agent identifier.
The example prompt is simple: it tells the site reliability agent to debug incidents and gives it tools for metrics, recent deployments and code differences. Those are the same resources a developer might use when investigating. The prompt can be made more detailed or constrained for another application.
Next we configure the execution environment. Anthropic had just introduced the option to bring your own containers and compute, so tool execution can run on your infrastructure as well as managed infrastructure. This demo uses an Anthropic cloud environment and unrestricted networking; the networking configuration can instead restrict the agent to an allowlist of hosts.
Private MCP tunnels offer another way to run tool servers in a private environment rather than on the public network. After creating the environment, we have separate identifiers for it and the agent. We then upload the incident log through the Files API so the agent can inspect it and run code over the data.
The information given to an agent shapes what it can do. Developers still choose and manage the context: which files to upload, how the agent should process them and what other information it needs. Those choices are configurable even though the surrounding infrastructure is managed.
Connect sessions, streaming and local tools
A session mounts the log and binds agent to environment. Events stream to the interface, while local tool handlers supply metrics, deployments and code differences.
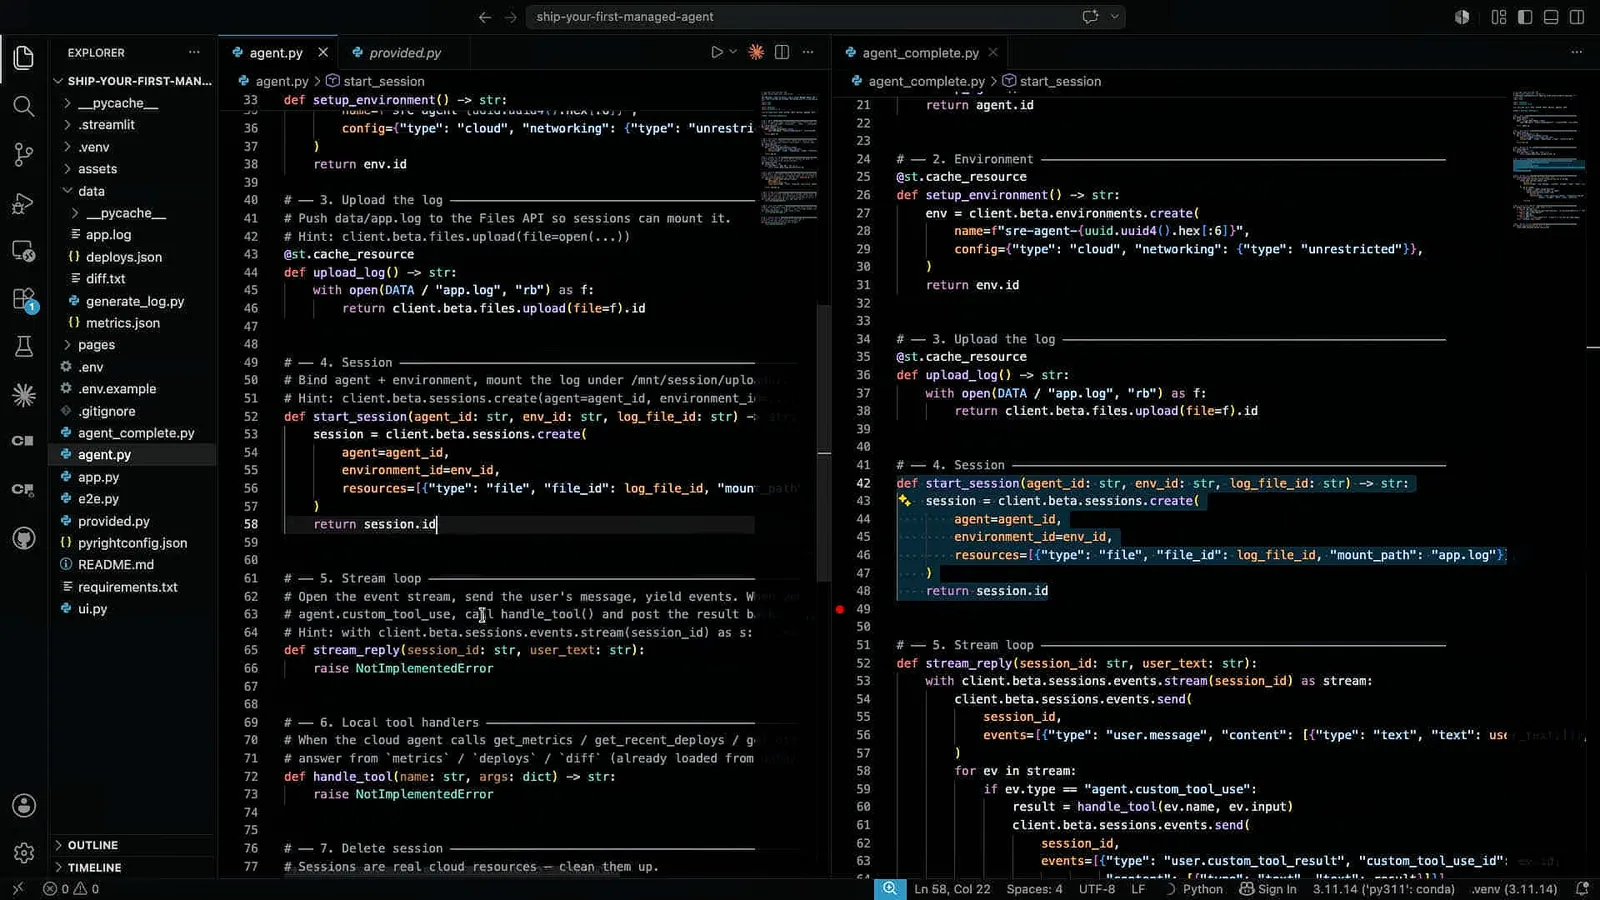
A session binds the agent identifier and environment identifier and mounts the uploaded log. It gives the agent a place to interact with the user. We then implement streaming so that the interface can show progress while the session runs.
Managed-agent sessions work in events rather than only a request followed by a final response. Events include user messages, agent responses and tool calls. They can be recorded for observability and streamed to the user, so someone sees the work as it unfolds instead of waiting for the whole task to finish.
At this point the agent can respond to a greeting, but it cannot yet retrieve the metrics we want: the local tool handlers have not been connected. The agent definition is on the server, while the missing execution code tells the application what to do when the agent calls a tool.
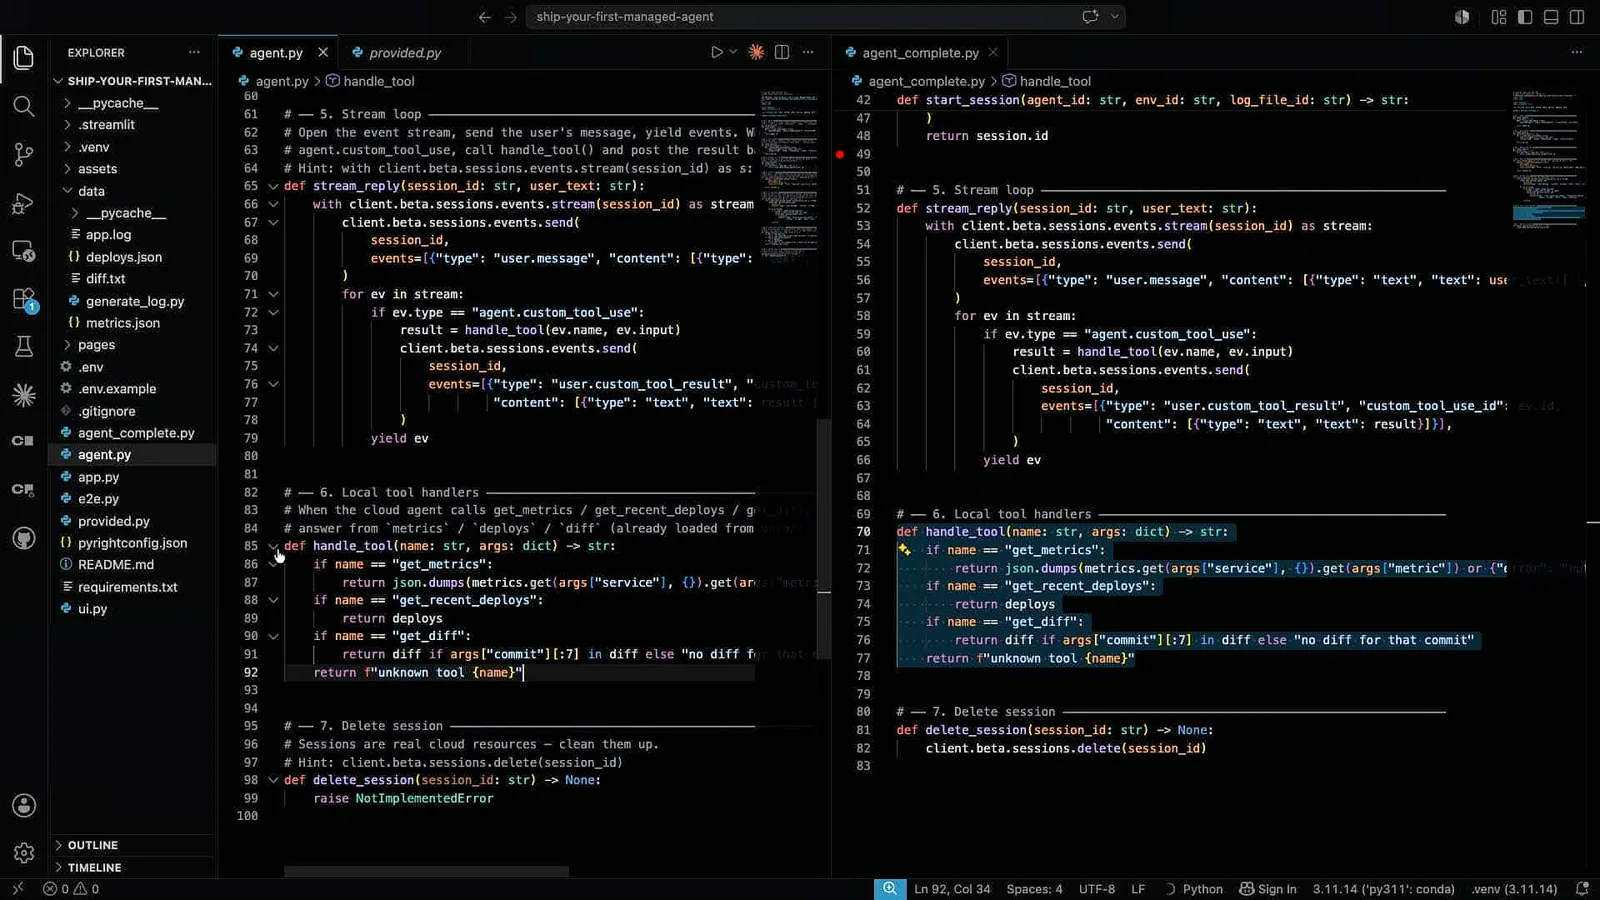
After adding the handlers, the agent can call `get_metrics`, `get_recent_deploys` and `get_diff`. We also add session deletion so a developer can actively manage sessions and the data retained for them. The app now has the pieces needed for a test run.
Investigate a simulated checkout incident
The agent inspects logs and tools before reporting a likely database pool problem and recommended actions. The demonstration also shows session persistence and deletion.
I start a session and ask the agent to debug the incident. It uses its sandbox to inspect the log, calls the recent-deployments tool and retrieves metrics; the interface streams those actions as they occur. The simulated signal is checkout p99 latency about ten times above baseline.
A real incident agent needs deliberate choices about tools and context. For example, it could be given a skill for reading runbooks: documents that explain how teams diagnosed earlier incidents. Past postmortems and runbooks give the agent the same operational background a human investigator would use.
The first live run needs another attempt, so I start a new session. The workshop tools read local example data from JSON files. The same approach could connect to a production metrics system such as Datadog, with tool execution running in the selected container and infrastructure.
The retry returns a diagnosis: a database connection pool appears to be exhausted after a change to the order-summary builder introduced a query. The agent presents the metrics it used, rules out other causes and recommends actions. Its tool calls are available in the session log and observability console.
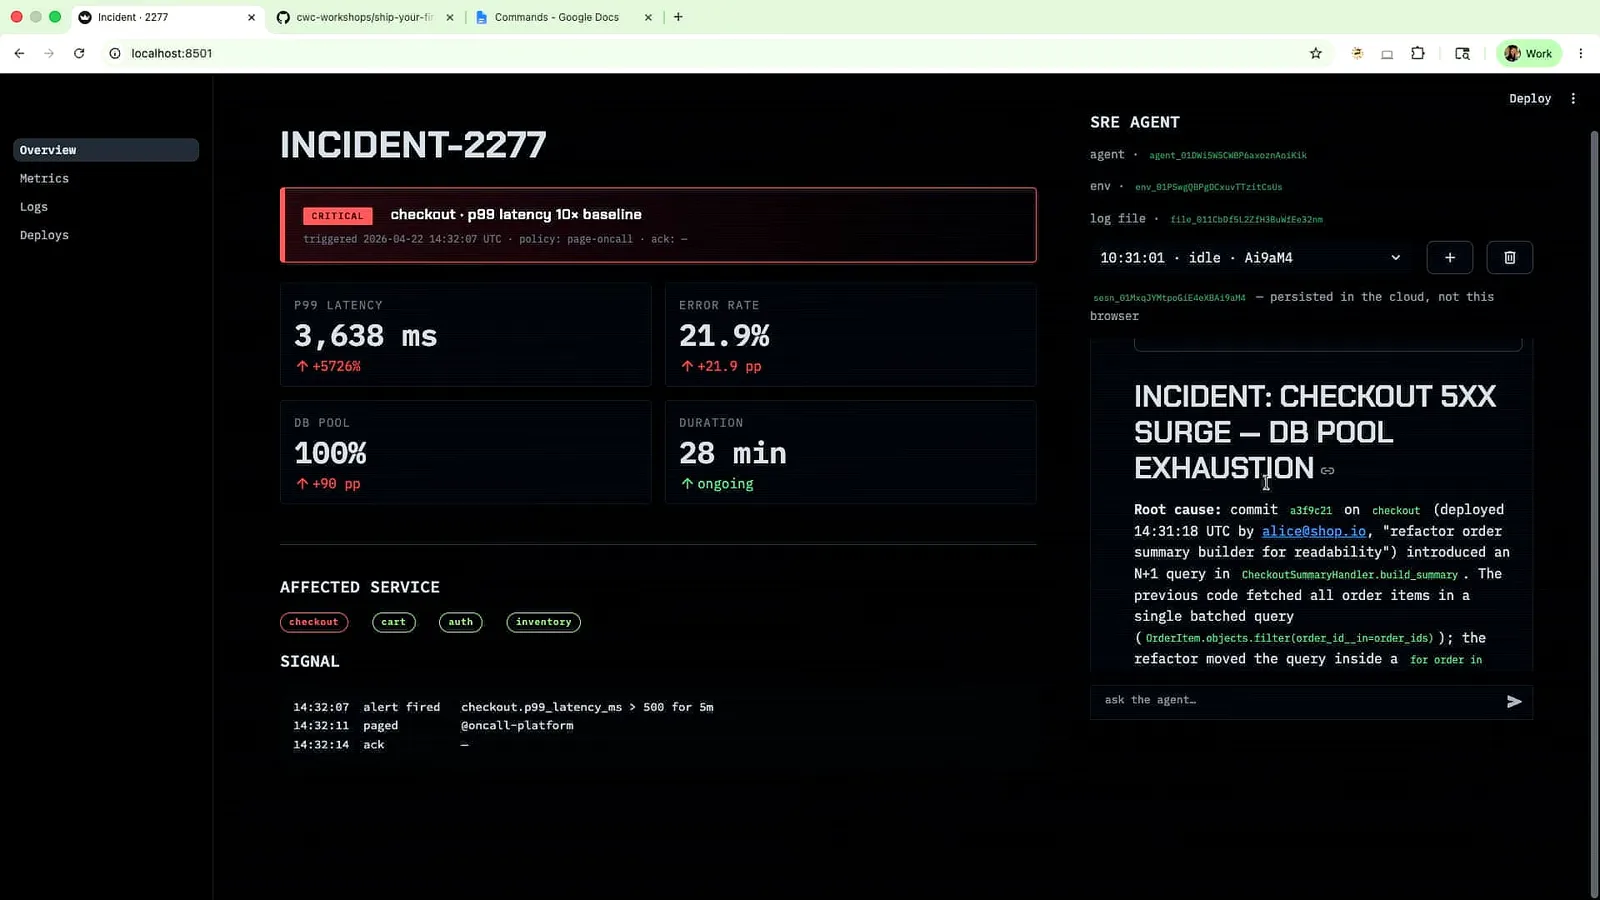
This demonstration stops at recommendations. A more capable incident workflow could connect the agent to a coding tool, let it propose a fix and open a pull request. That would extend the work from initial investigation toward addressing the root cause, with a human overseeing the actions.
I refresh the app and the sessions remain available because their state is maintained server-side. A previous session can be resumed with another message, and the delete action removes a session from the list. The interface also shows a session as running or idle as the work proceeds.
To recap the build, we defined an agent, an environment and the data it needed; joined them in a session; streamed responses and tool calls; implemented local handlers; and added session deletion. The Streamlit interface made each piece visible as the investigator came together.
Understand event logs, execution and session states
He recaps how append-only session events, separated tool execution and state transitions support resumption. Webhooks can trigger or resume work.
Underneath the interface, events are appended to a session log rather than treated only as a single request and response. That record helps with observability and resumption. Because tool execution is separate from the agent loop, a failed container can be started again without restarting the entire loop.
In this workshop the local tools read files on our laptops while the agent loop runs in Anthropic’s managed infrastructure. With customer-provided compute or containers, developers can choose where tools execute. A local JSON-backed tool could be replaced with a client for a production service while using the same protocol.
Sessions also have states: idle, running, rescheduling when a retry is needed, and terminated after an unrecoverable failure. Events can be used to trigger behavior around those states. For example, a webhook could cause an agent to resume a session or start work in response to something external.
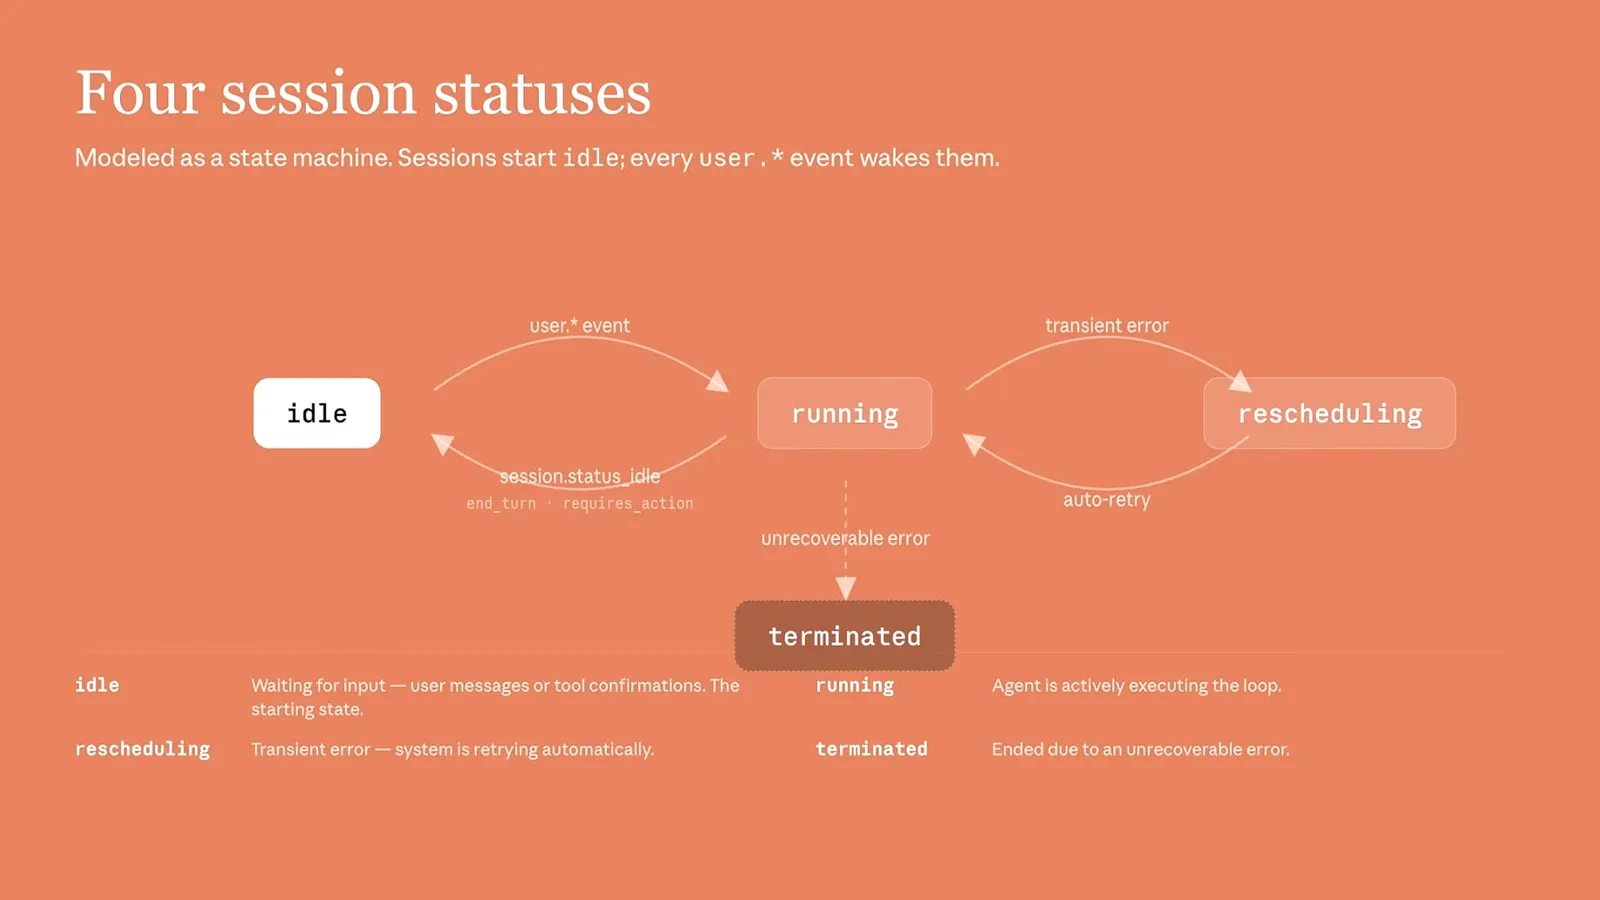
The basic agent already uses managed handling for work such as compaction, caching and tool calls. Additional features include subagents with separate context windows, memory, outcomes and skills. An orchestrating agent can delegate tasks to subagents and combine their contributions, including in parallel.
Extend the basic agent with production features
Subagents, memory, outcomes, vaults and permissions provide further ways to build on the basic example. He points to the console and documentation for additional exploration.
Memory and dreaming are intended to help retain relevant preferences and corrections across sessions. Outcomes let a developer define a rubric for the result, so the agent can choose tool calls in pursuit of that result rather than simply execute a fixed series of actions.
Vaults address credentials by separating encrypted storage from what the agent can access, with controls by user and session. Other features include webhooks, permission policies, MCP server controls and an agent builder in the developer console. I encourage you to explore the documentation and the follow-on session for the details.
同じチャンネルの記事
 16:17EN
 Claude· 2026年11月6日How Salesforce doubled effective coding output with Claude CodeBoris Cherny, Muralidhar Krishnaprasad, Richard Pack · AnthropicSalesforce describes how it measures AI-assisted work, trains engineers to use agents, and checks the resulting code for defects.
 10:38ENClaude· 2026年10月23日Factory’s Matan Grinberg on building software agents people can trustKai Gill, Matan Grinberg · AnthropicFactory’s CEO says an agent learned from one bank’s COBOL migration, reducing human involvement in the next by 90%.
 12:19ENClaude· 2026年10月8日Shopify’s Mikhail Parakhin: Spend on AI to do what was once impossibleBoris Cherny, Mikhail Parakhin · AnthropicShopify’s CTO describes a merchant prediction system and argues for using the largest models in development, then cheaper ones in production.
 33:46ENClaude· 2026年10月6日How Every builds a shared AI coworker that learns a team’s styleKatelyn Lesse, Dan Shipper, Willie Williams · AnthropicEvery’s Slack agent shares workflows, learns from an editor’s past changes and uses isolated sessions to respect access boundaries.
 17:50ENClaude· 2026年9月24日Patrick Collison on shipping faster with AI without losing reliabilityBoris Cherny, Patrick Collison · AnthropicStripe’s CEO describes isolated development, hard security boundaries and an AI-assisted project built by two to three engineers in two months.
 34:42ENClaude· 2026年9月8日Three founders on verifying, scaling and paying for AI agentsLance Martin, Sahaj Garg, Mihir Garimella, Todd Olson · AnthropicWispr, Actively and Pendo explain how they build agent products, test their work and decide what infrastructure to manage themselves.