En 30 secondes
Theo Browne reviews Anthropic’s account of improving performance across Claude’s web and desktop apps with Claude-assisted engineering. He explains user-journey instrumentation, deterministic benchmarks, regression guards, staged rollouts and human decisions about experience and complexity. He also demonstrates delayed sidebar updates and offers hypotheses about their causes, while acknowledging that he lacks access to the code and has not established those causes.
- 1Start with real user journeysAnthropic reports measuring 13 flows across four user journeys and reducing fresh web load time at the 75th percentile from 3.1 seconds to 0.55 seconds.
- 2Instrument before optimizingThe team made client and server timing comparable, then used measurements to choose and validate projects.
- 3Validate the benchmark itselfInstruction counts and browser metrics were kept only when they tracked real latency, with CI ratchets to prevent regressions.
- 4Performance and data freshnessTheo observes delayed sidebar updates and suggests possible explanations, but explicitly lacks access to confirm the cause.
- 5Human review and rolloutAnthropic describes human approval, short-lived feature flags and incremental rollout, while Theo stresses direct testing.
- 6A 120 Hz frame budgetA dedicated test rig helped the team identify streaming bottlenecks and monitor a roughly 8.3-millisecond frame budget.
À retenir
- Measure user journeys from interaction to rendered result before optimizing, and test whether laboratory metrics correlate with real latency.
- Deterministic benchmarks and CI ratchets can help protect performance improvements, but an inaccurate metric can encourage the wrong behavior.
- Human review, feature flags, staged rollouts and hands-on testing help assess the risks of rapid agent-generated changes.
- Faster initial rendering and correct cache invalidation are distinct user-experience requirements.
- Anthropic reports improved core journeys and streaming smoothness; the figures apply to its stated measurements and rollout.
Lire le texte remanié, chapitre par chapitre
A performance sprint and its results
Theo reviews reported user-journey improvements and tests the app himself. He observes faster navigation along with delayed sidebar updates.
I love the details of full-stack performance: data loading, browsers and the way a system feels end to end. Anthropic says it made the core Claude web and desktop experience about three times faster in a two-week sprint, largely with Claude. I want to see what the team measured and what tools it gave the model.
The article reports that four journeys account for 95% of activity: launching the app, starting a conversation, loading one and sending a message. At the 75th percentile, fresh web load to a typeable page fell from 3.1 seconds to 0.55 seconds; starting a Claude Code session fell from 0.8 to 0.3 seconds.
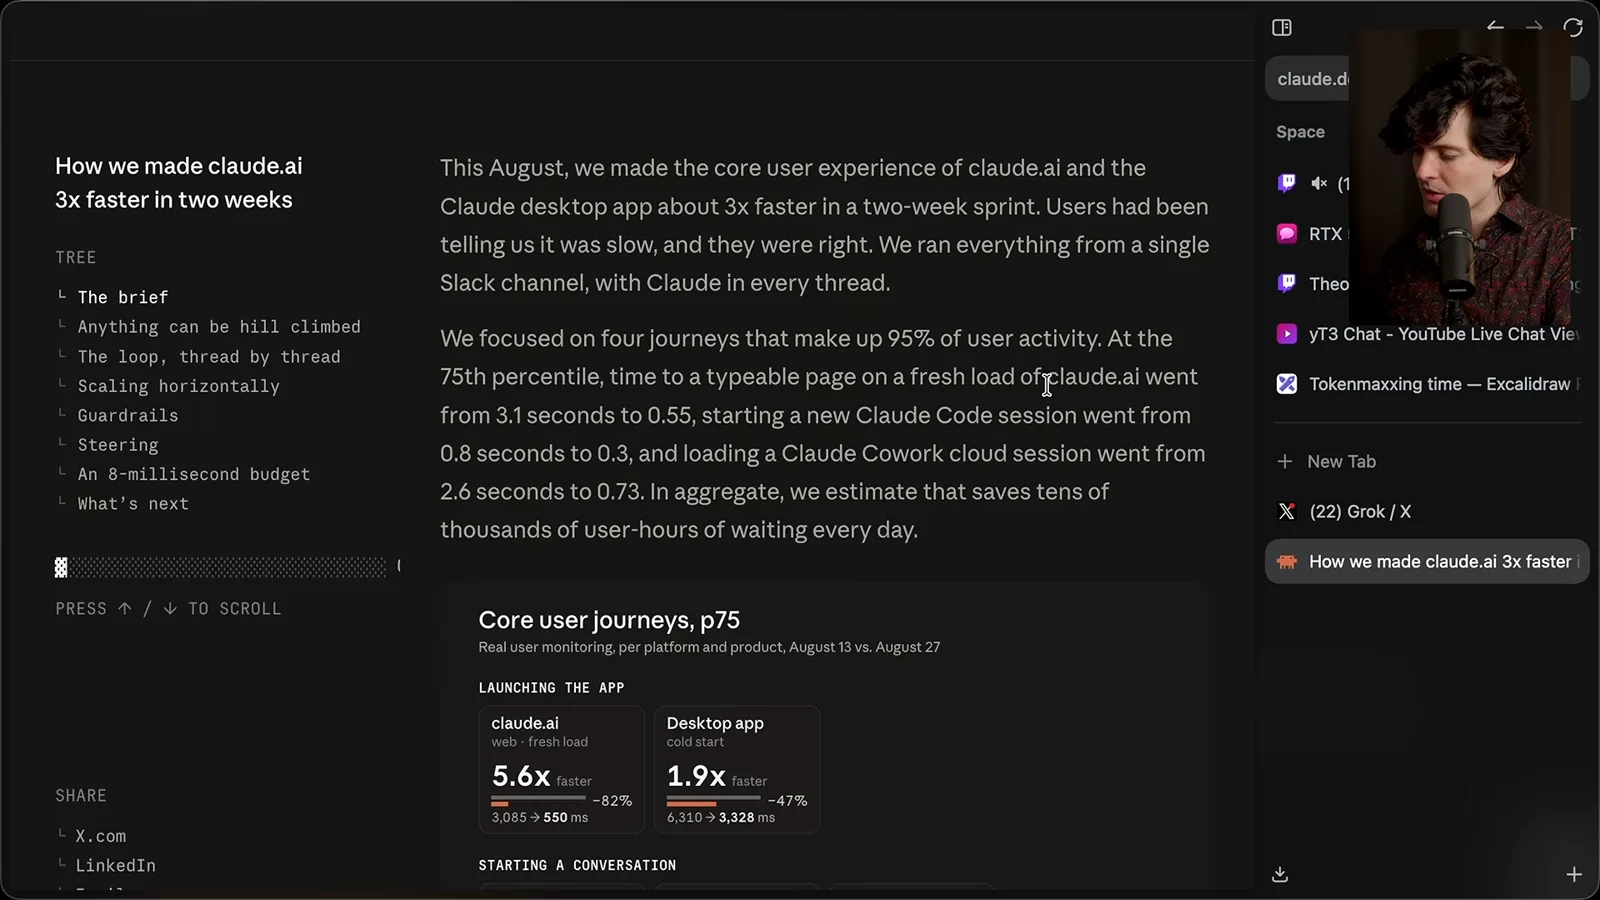
The same report says a Claude Cowork cloud session fell from 2.6 seconds to 0.73. Its desktop cold-start example fell from about 6.3 seconds to 3.3. These are specific measured journeys and percentiles, not a promise that every interaction is three times faster.
I noticed some earlier improvements myself and had seen the site adopt TanStack Router. I am curious how the team found additional gains after a framework change, particularly because performance needs to include what a user can actually do, not just when an internal component reports it has loaded.
In my quick browser test, a refresh and sending a prompt felt faster. But when I refreshed immediately after creating a thread, it did not appear in the recent list right away. Later the missing threads appeared, so what I saw demonstrates delayed visibility, not proof that the conversation was permanently lost.
Both ChatGPT and Claude have used local caching for recent items, and Claude’s sidebar appears to use IndexedDB in this example. Showing cached data can avoid an empty sidebar during load, but it introduces a second question: when and how does the displayed data reconcile with the server?
I deleted two threads in another browser and then refreshed. The old entries remained visible for a while and clicking them failed; later they disappeared. I suspect stale caching or invalidation, but I cannot inspect Anthropic’s code here, so I cannot establish exactly which implementation caused the delay.
In T3 Chat, we show cached content in a faded state until fresh server data arrives, rather than presenting it as certainly current. That is a different product and design choice. It illustrates the tension: make a page feel immediate without concealing the fact that cached data may be stale.
I also notice a slow-loading picker in T3 Chat and ask an agent to investigate caching its data. This is the type of detail that becomes visible when you actually use the interface. Faster paint is useful, but it should not be the only target if other controls are still waiting.
Anthropic says the team worked in a shared Slack channel through Claude Tag, using an internal research model described as roughly comparable to Opus 5.5. The team reports more than 3,000 changes and no customer-facing incident or rollback during the sprint. My sidebar observation is a separate observation and does not independently verify the sprint’s incident count.
I wondered whether model guardrails might complicate deep performance work, then checked an example of my own and found the actual interruption was a safety check on a removal command. That correction matters: I do not have evidence that a browser-profiling guardrail caused that particular stop.
My experience has been that OpenAI models can be good at persistent performance investigations, partly because of available computer-use tools. Both model families still need useful instrumentation, and I often inspect the results myself. A claim that an agent can optimize a system says little unless it can observe the relevant behavior.
Anthropic gave the Slack channel a standing performance mission, including monitoring deployments, evaluating telemetry, maintaining dashboards, proposing opportunities and communicating with humans. Claude used a Datadog MCP connection to identify the four highest-impact journeys; the team then defined 13 comparable measurements across products and platforms.
Instrument the work and identify opportunities
The team establishes comparable measurements and ships initial optimizations. Theo discusses agent direction and a separate runtime experiment.
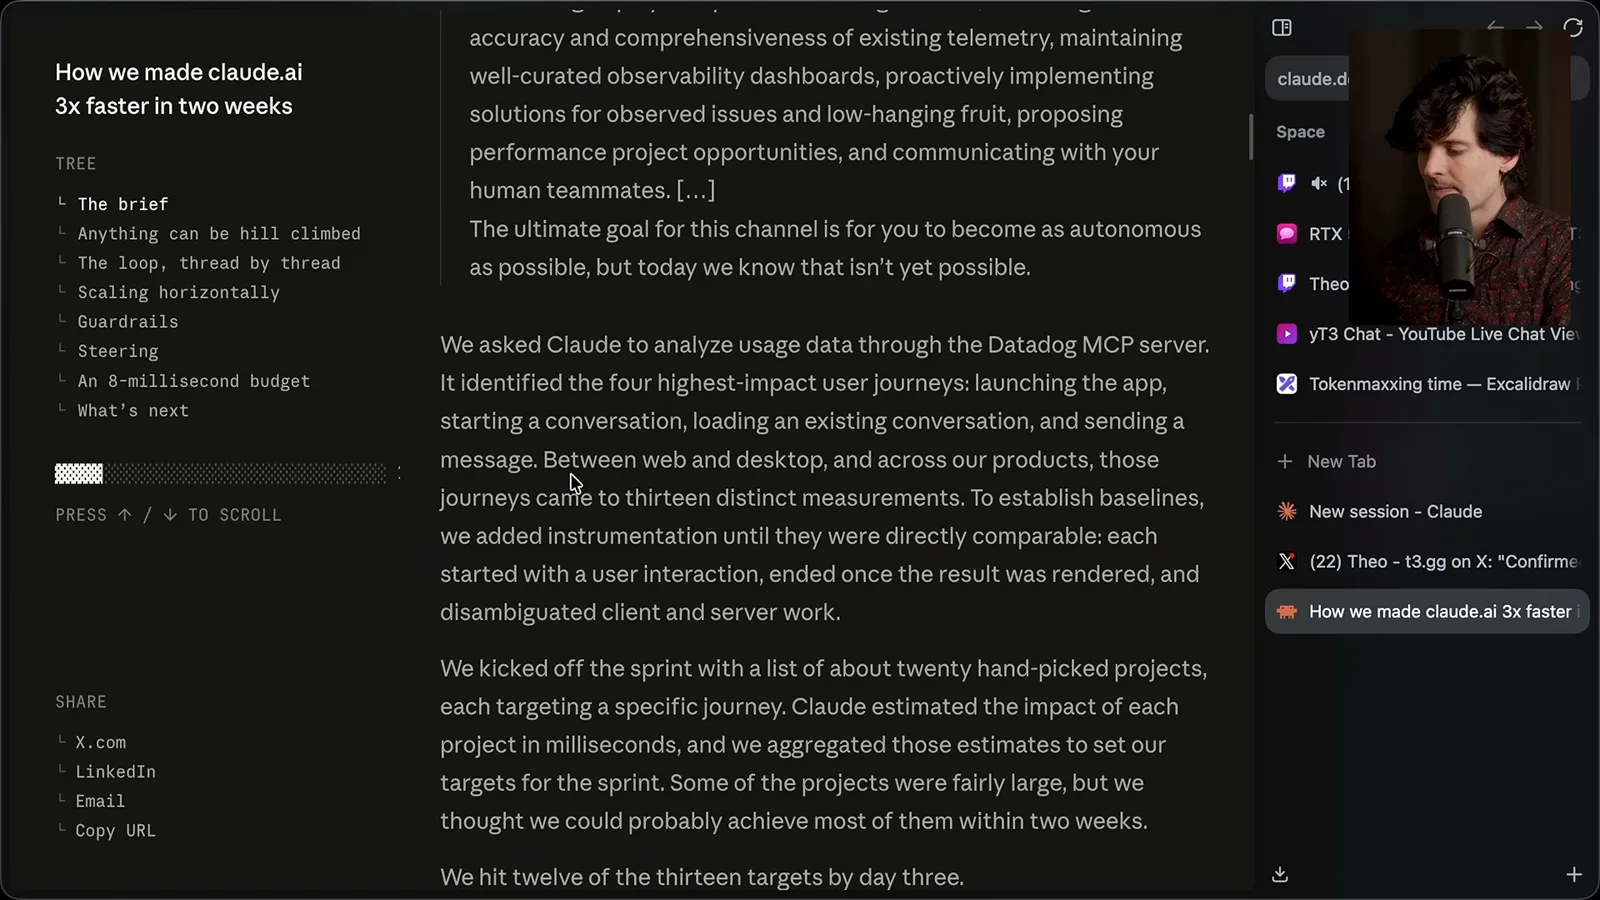
Each measurement started with a user interaction and ended when the result was rendered, separating client and server work. That is important: I have seen dashboards report a 200-millisecond component transition while ignoring the many seconds it took to reach that component. A fast partial trace can hide a slow user experience.
The team began with about 20 selected projects and used estimated millisecond savings to set targets. The article says 12 of 13 targets were reached by day three. I joke that models often overestimate how long agent work will take, but the observed schedule alone does not prove why the original estimates were conservative.
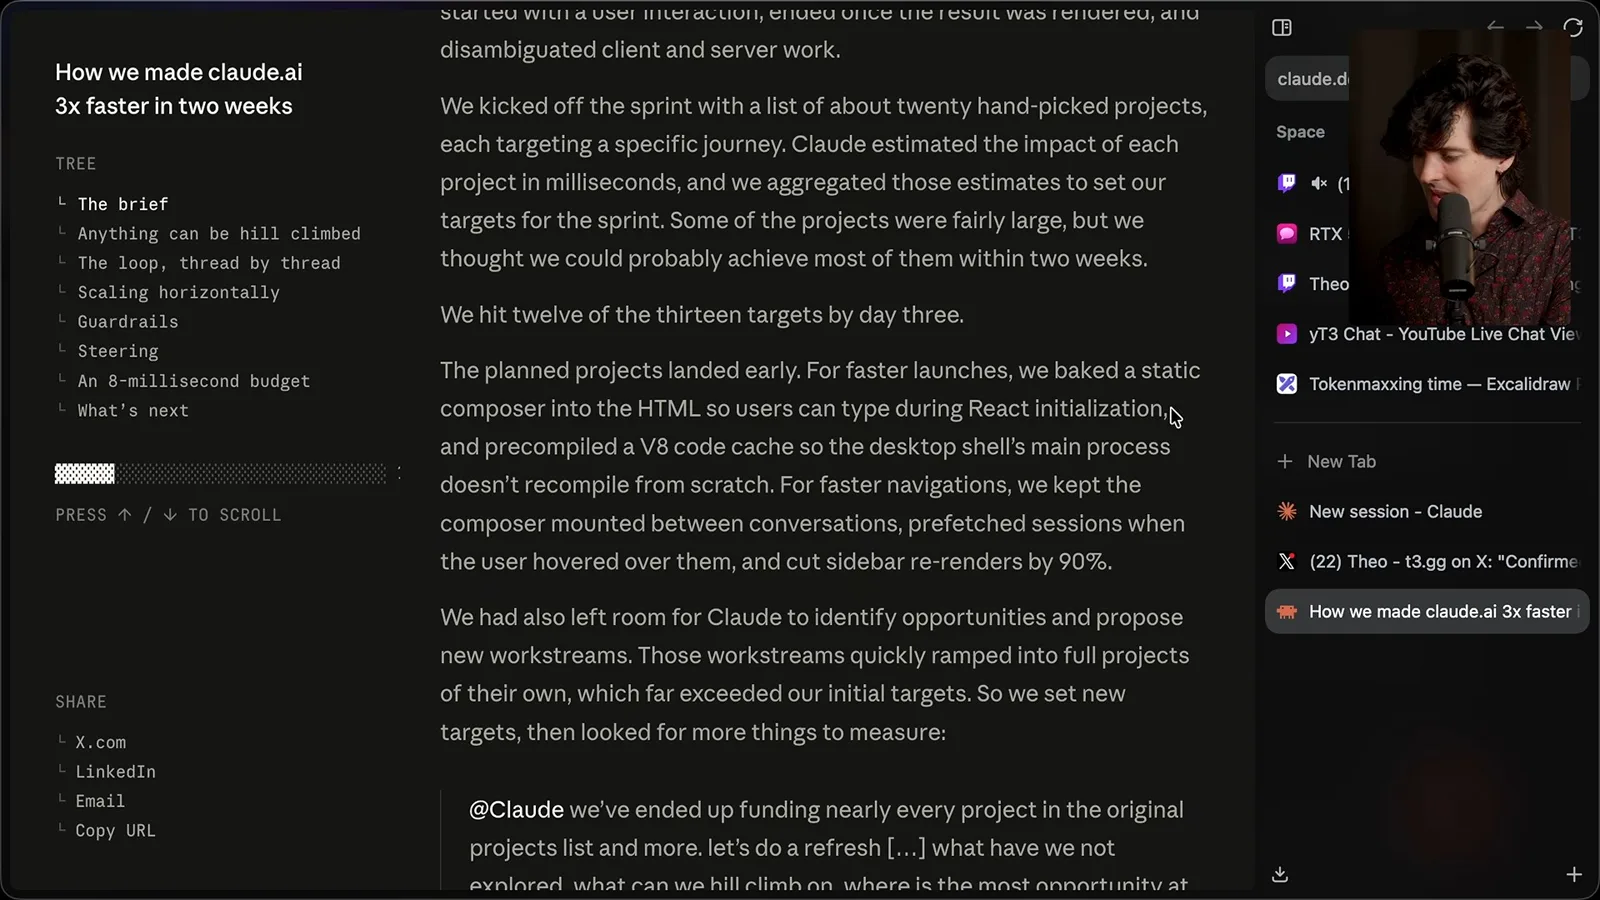
The early changes included embedding a static composer in the HTML so users could type during React initialization and precompiling a V8 code cache for the desktop main process. Keeping the composer mounted between conversations and prefetching sessions on hover helped navigation; the article reports a 90% reduction in sidebar rerenders.
Prefetching on hover is one of my favorite tricks for making navigation feel immediate. It is still necessary to consider what happens when the prefetched data changes. A fast path is only valuable if the result is accurate and the user can understand what is happening.
Anthropic also invited Claude to propose new work after the initial projects. I like making room for unusual ideas when the system has adequate tests. Asking an agent for ambitious proposals can reveal options that a narrow instruction might not surface, but a proposal still needs validation and a decision about its tradeoffs.
I tried a similar approach on Lakebed and asked for extreme performance ideas. The agent proposed a persistent V8 execution service, a query compiler and durable local ownership of app data. I pursued the first and report a two- to fourfold improvement in my workload; I did not implement the other two ideas.
That Lakebed work was not a single magic prompt. We spent time building ways to check performance and detect behavior regressions, and the work ran for hours with interruptions. The useful pattern was to give the agent room to explore while also creating evidence that the result actually worked.
Benchmarks, ratchets and user outcomes
Deterministic metrics allow repeated testing, but must correlate with real latency. Theo shares his own performance regression tests and cautions against optimizing proxies blindly.
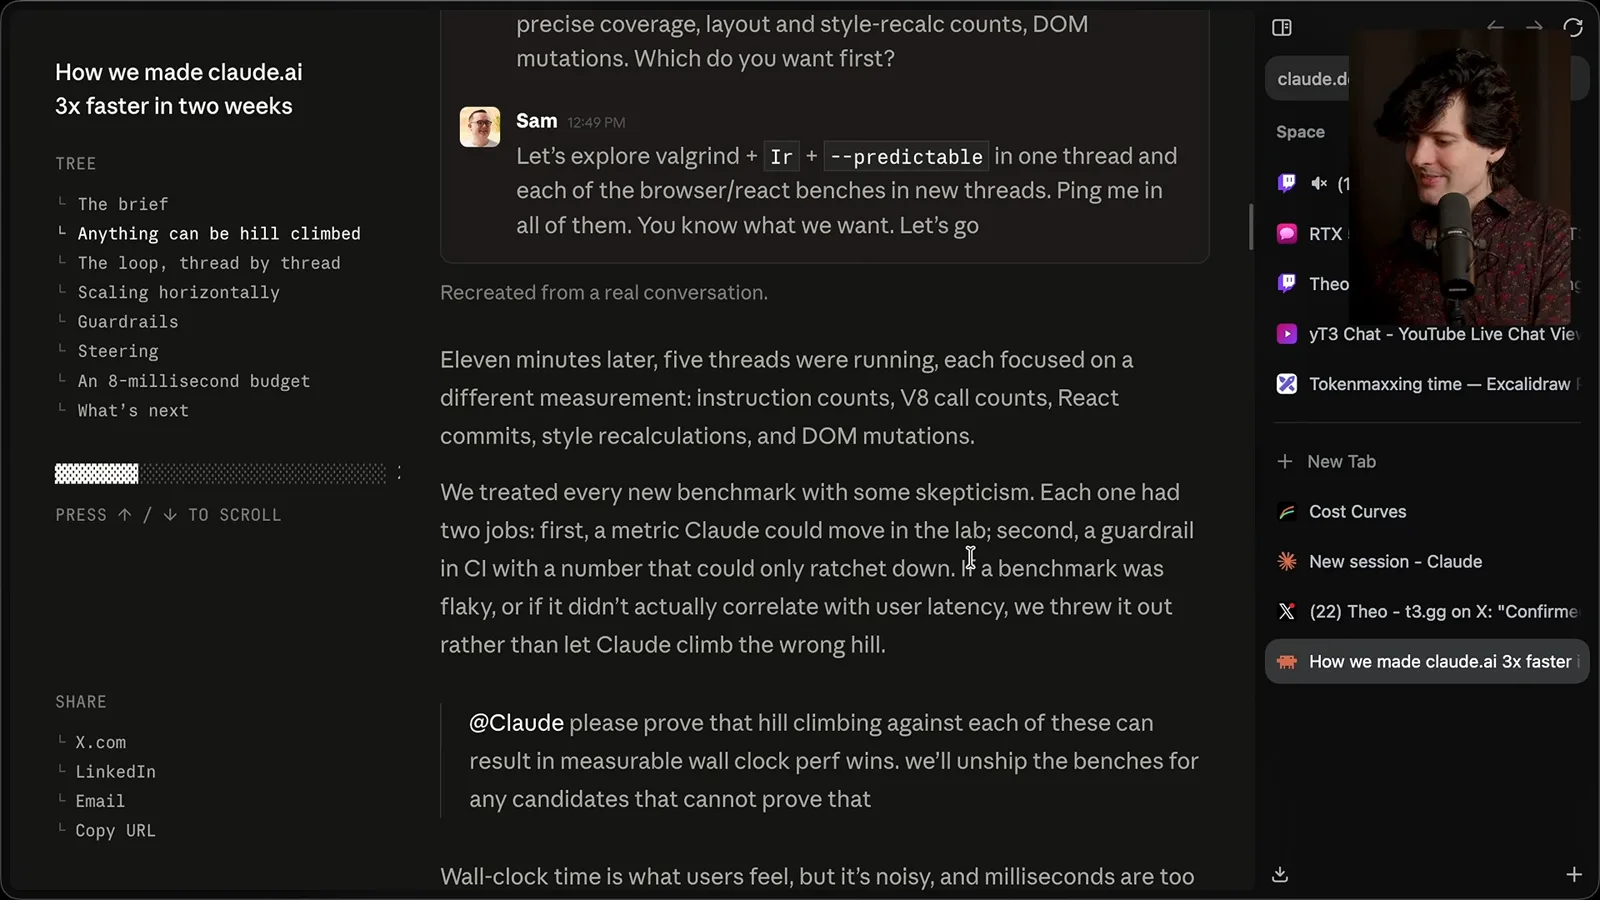
Anthropic wanted to iterate faster than its deployment cycle. Wall-clock timings are meaningful but noisy, so the team explored deterministic proxies: JavaScript instruction counts, V8 call counts, React commits, style recalculations and DOM mutations. Several investigations could run in separate threads at once.
For pure JavaScript hot paths, the article describes using Valgrind with Node’s predictable mode and comparing instruction counts against a checked-in baseline. Browser work needed different measurements. Each measurement makes a different kind of behavior visible, and none automatically proves the page feels faster.
My concern is that an agent optimizing call counts or requests could eliminate work that preserves freshness, even when the work is not blocking interaction. I think this could be relevant to the sidebar behavior I saw, but it is only a theory. I have not verified what change caused that behavior.
For performance work I often ask for several theories, have agents build candidate improvements, and then try the actual experience myself. Small user-experience regressions can be missed by a numerical metric. The test should reflect what matters to a person using the application.
The article says the team treated every new benchmark skeptically. A useful metric needed to move in the lab and serve as a CI guardrail; if it was flaky or did not correlate with user latency, the team discarded it instead of optimizing the wrong target.
In T3 Code I reduced the amount of data needed to open large threads and added a CI action that measures transfer sizes for representative stored thread data. The action can signal a regression to both the implementation agent and reviewers. It does not replace checking whether the resulting UI behaves correctly.
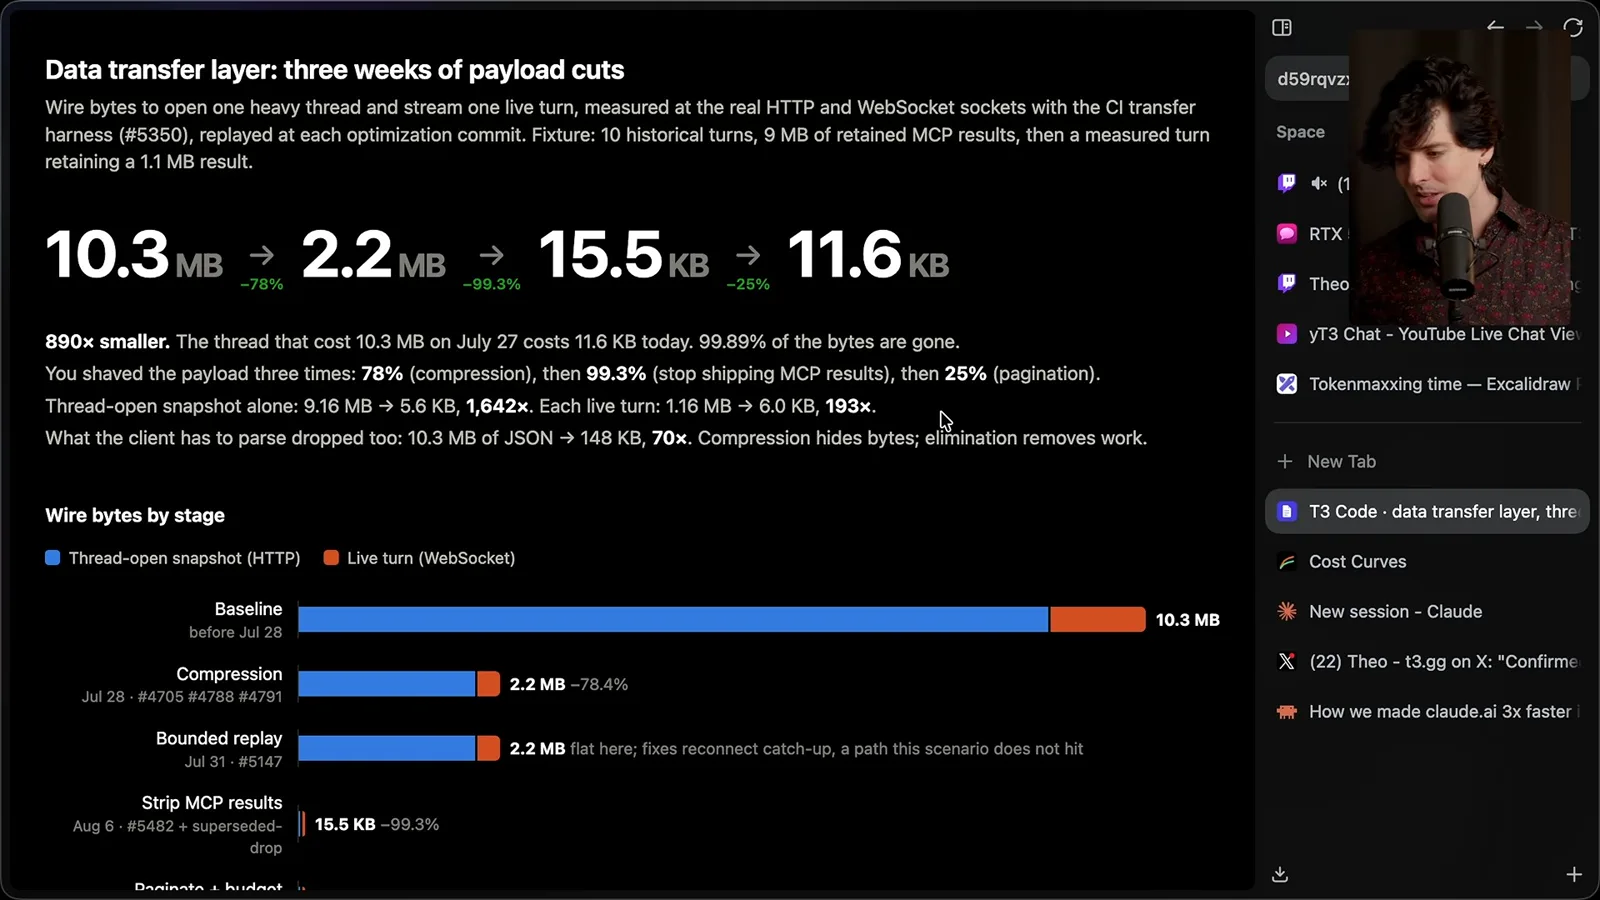
An agent helped produce that test suite. I had not personally read every line, but its signal has helped catch regressions in my work. I see value in using agents to build measurement tools even when the generated test code is not part of the shipped product.
Anthropic compared instruction counts with wall-clock timing on two hot paths: message-tree assembly and a status-line scanner. It reports instruction reductions of 48% and 31%, with wall-clock reductions of 78% and 44%, respectively. The chart does not give the absolute durations needed to assess the practical impact by itself.
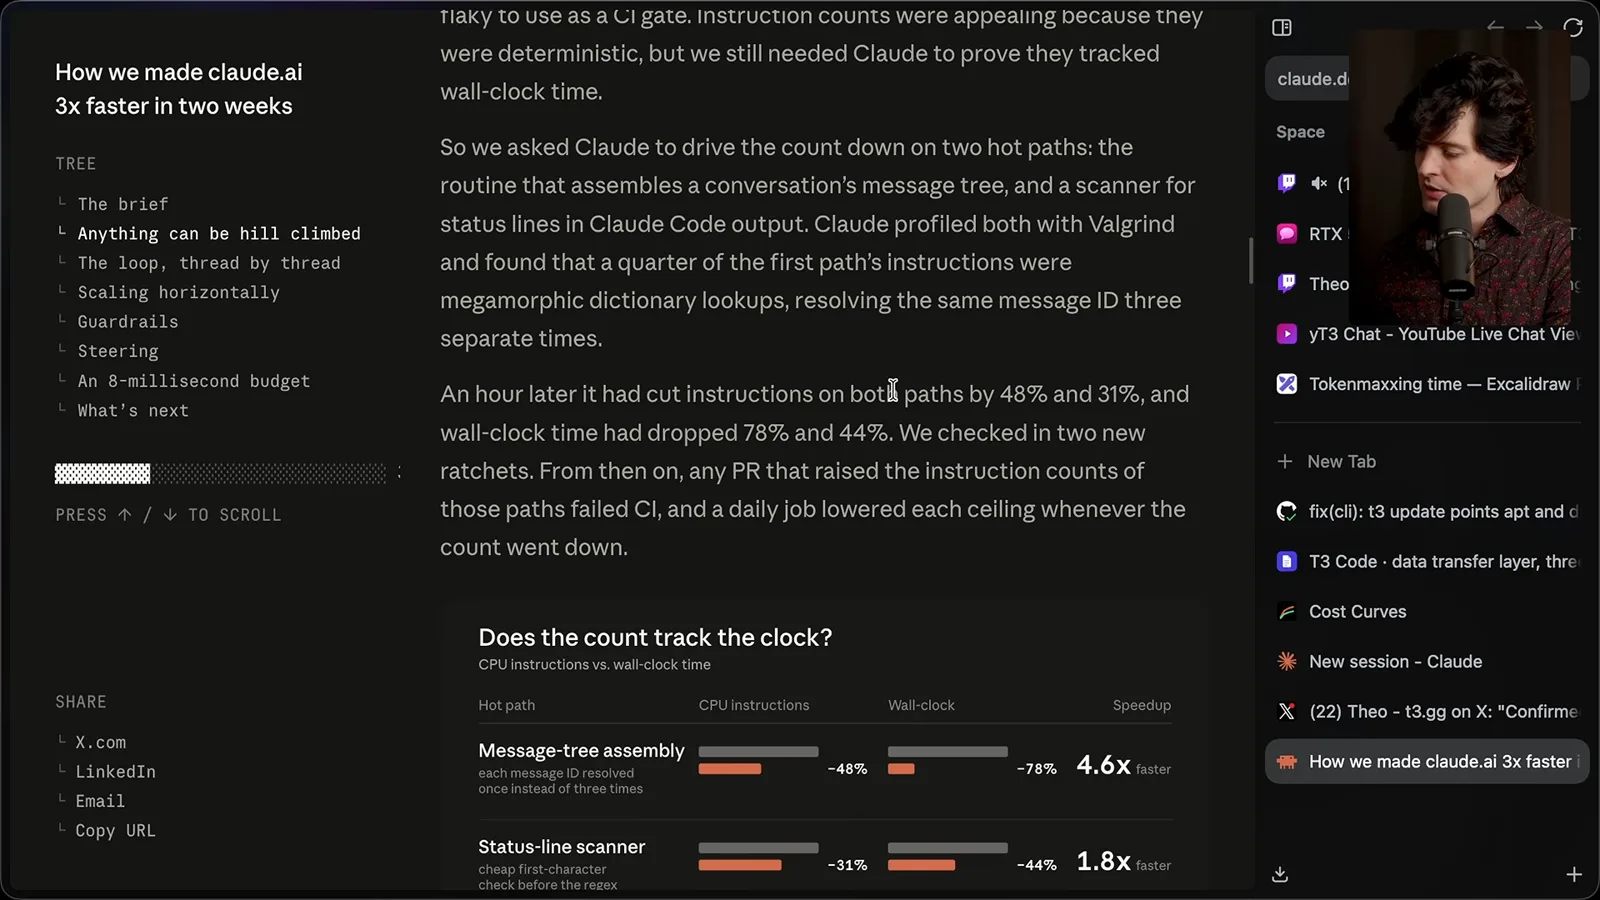
The team added CI ceilings for those counts and a daily job to lower a ceiling when a path improved. I like that ratchet: otherwise a real improvement can quietly become room for a later regression. Still, a threshold must be maintained thoughtfully as the implementation and user goals change.
I have seen a numerical quality gate become counterproductive. At Twitch, I describe being unable to delete a large unused implementation because removing it changed the aggregate coverage percentage, even though its replacement had full coverage. A metric can prevent an improvement when it is treated as the objective rather than a signal.
The larger lesson is that measurement gives an agent something concrete to improve. But the number must represent a problem worth solving, and the team must check the result against the user experience. Instrumentation is not a substitute for judgment about the product.
The optimization loop and sidebar behavior
The article describes a lab-to-deployment loop and a layout-shift example. Theo distinguishes user-visible behavior from his unverified theories about cache regressions.
Anthropic describes a repeated loop: a person opens a thread about a slow journey, Claude traces and benchmarks it, and the resulting PRs are sized for risk and review. User-visible changes go behind flags; after deployment, field data determines whether to keep the change, turn the flag off or iterate.
That loop includes real-user data, which matters. I also want the engineer requesting and merging changes to try the result directly. Some regressions are rare or annoying enough to matter, but not obvious enough for users to report them in a way the team sees.
For T3 Code, I made a GitHub label trigger a macOS desktop build so I can download and test a PR on another machine without manually building it. Reducing the friction of trying a change makes hands-on review more likely. That infrastructure can be just as useful as another dashboard.
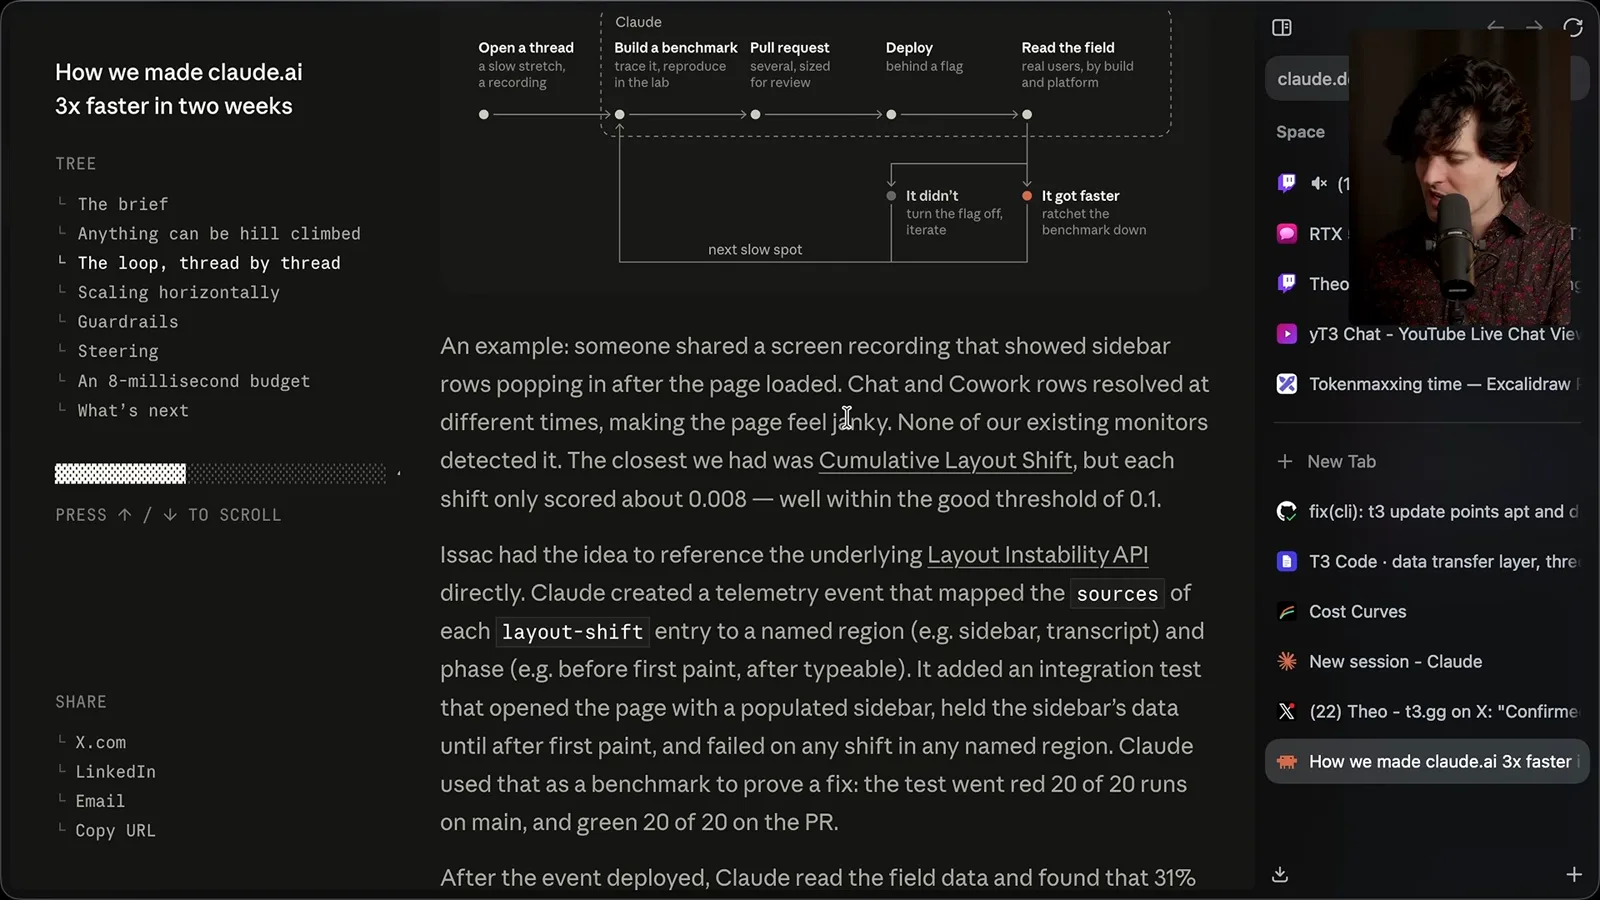
A screen recording in Anthropic’s article showed sidebar rows arriving at different times. Existing cumulative layout shift monitoring did not catch it: each shift scored around 0.008, below the usual 0.1 threshold. The team added a more specific event and an integration test for shifts in named regions.
I wonder whether a test that forbids any later shift could discourage updating a locally cached sidebar when the server returns a changed list. That is a possible failure mode, not an established explanation for the stale entries I observed. The article does not give me access to the implementation needed to prove it.
The field event reportedly found movement after the page was usable on 31% of web loads. Claude worked through causes such as a late header, a moving caret and a scrollbar appearing. Cached content can reduce visible movement, but the team still needs a strategy for reconciling stale and current data.
A viewer asks how I could spot problems without reading the code. I can observe behavior and form a theory from experience, but I may be wrong. With repository access, I would ask an agent to test that theory against evidence before telling the team what to change.
This is where engineering intuition still matters: understanding user flows, recognizing likely failure modes and questioning whether a test captures the real issue. I learned much of that by working on these systems manually; I do not have a simple recipe for building the same intuition today.
Scaling investigations and fixing hotspots
Once tests exist, agents can explore many issues in parallel. Theo discusses reported React, CSS, caching and syntax-highlighting hotspots.
Once an investigation and its tests work for one issue, the team can run similar work in parallel across many threads or machines. In my T3 Code example, agents merged many performance PRs after I built the testing setup. I report two visible regressions, which shows why the checks and review still matter.
Anthropic says individual threads sometimes opened dozens of optimization PRs and that Claude also created new investigation threads. One reported census found 6,900 React hooks and 900 store subscriptions in the composer’s typing path, rerendering on each keystroke. The number is specific to that reported investigation.
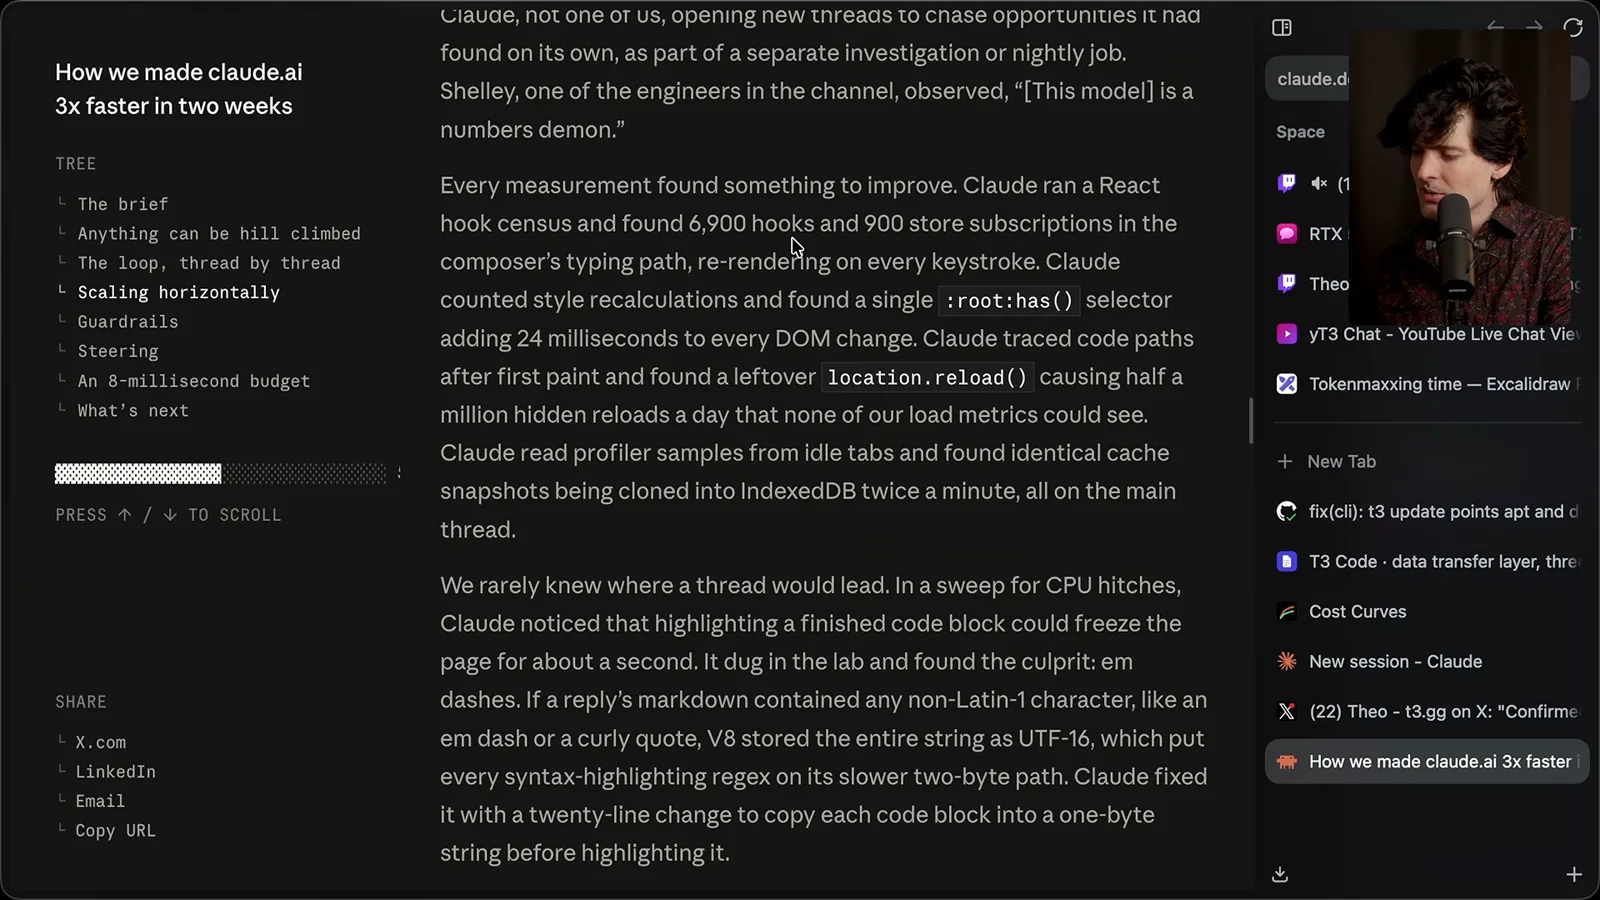
Another reported finding was a root :has() selector adding 24 milliseconds to DOM changes. A leftover location.reload() path caused hidden reloads, and identical cache snapshots were reportedly copied into IndexedDB twice a minute on the main thread. These are concrete examples of how profiling can reveal non-obvious work.
I speculate again that changes to the IndexedDB path might be related to the sidebar issue, but I cannot verify that link. It is tempting to turn a plausible story into a diagnosis. Without a trace or the code, I can only offer it as a question to investigate.
In another reported investigation, syntax highlighting a finished code block could freeze the page for about a second. Anthropic attributes the issue to a response containing a non-Latin-1 character, causing a slower two-byte string path for highlighting regexes. Copying code blocks into one-byte strings before highlighting reduced the measured blocking in its example.
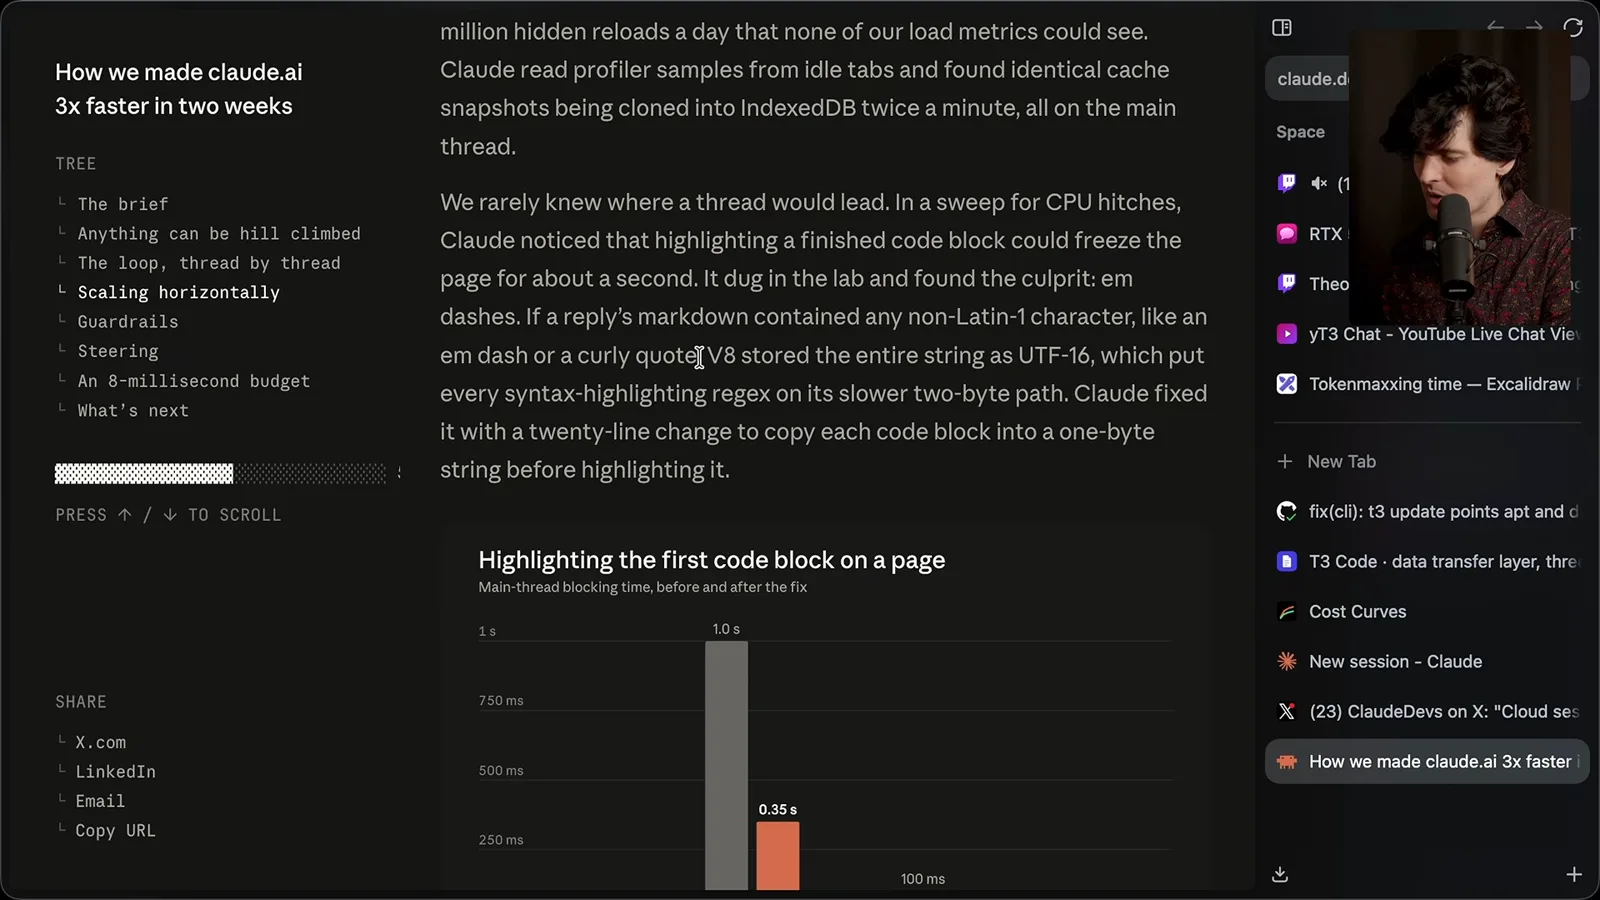
I prefer moving expensive syntax highlighting off the main thread. In T3 Code, I describe a worker-based approach and a visual fade while highlighting finishes. There are bundle-size and loading tradeoffs, but the objective is to keep navigation responsive while background work happens.
Anthropic says its busiest days saw over 200 changes, and about a third of PRs added telemetry or guardrails. A shared channel let people from multiple teams discuss the work and request reviews. Shared context can make parallel work easier to coordinate, provided someone remains accountable for decisions.
Guardrails, rollouts and human steering
The team describes human approvals, tests, flags and gradual rollout. Theo considers ambition, user-experience judgment and the cost of unnecessary complexity.
According to the article, every PR received automated reviews and at least one human approval, tests preceded optimizations, and potentially user-visible changes used short-lived flags. The team introduced nearly 200 flags and had cleaned up more than half by the end. These are the team’s reported practices.
The static composer needs its early HTML and React-rendered version to align. The team says it generated static markup from the real component, compared 14 viewport sizes within one pixel and tested typing through the handoff for lost or reordered keys. It also measured movement in the field.
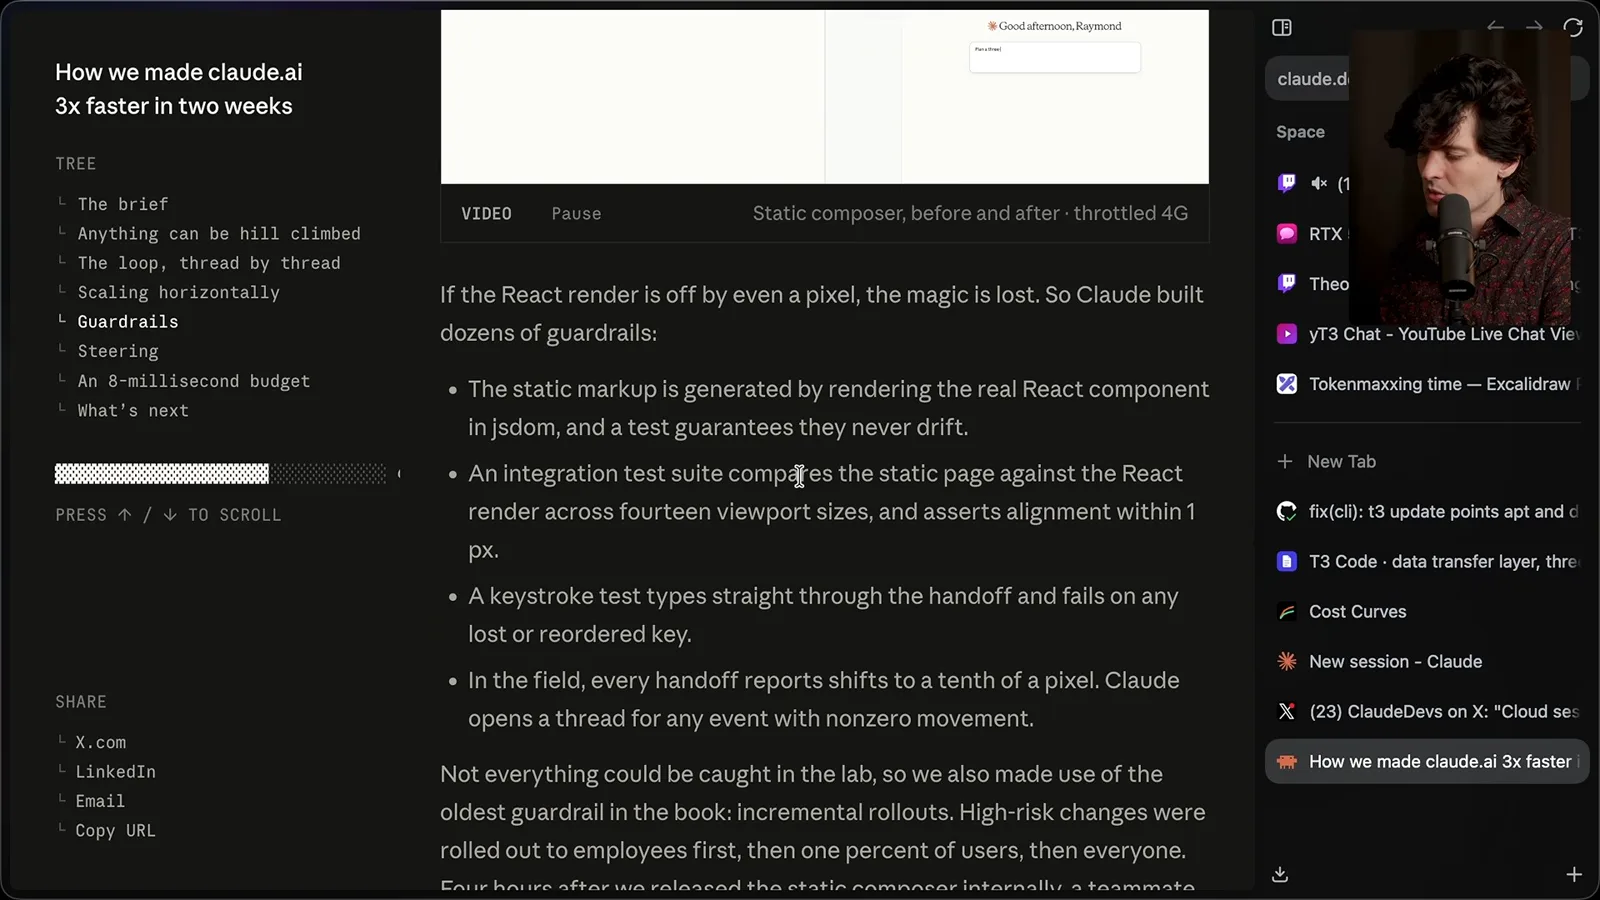
High-risk changes went to employees first, then 1% of users, then everyone. An employee still found a composer shift that the existing metrics missed. That is a good reminder that staged exposure and human observation can discover things a lab test does not cover.
The reported cause was Chrome speculative prerendering on an organization-managed browser. The new-tab page had a footer that reduced the viewport height; the prerendered Claude page inherited that height, then resized after navigation. The team pinned the layout across the resize and added a test for the flow.
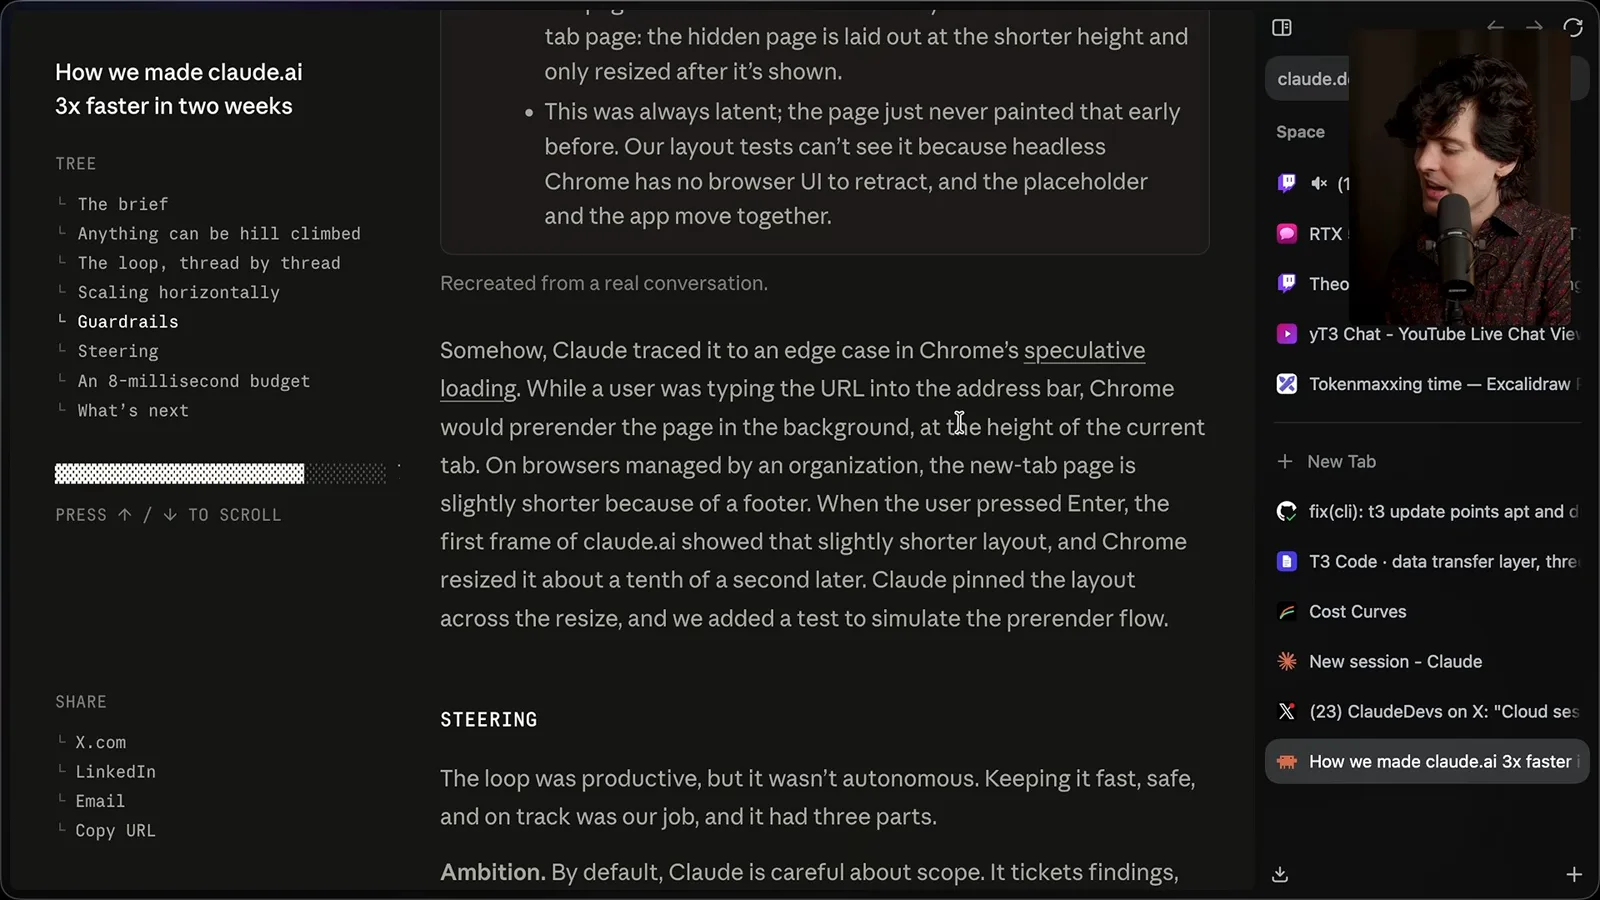
This is an interesting browser edge case because the page can be rendered before the user navigates, using dimensions that subsequently change. My first guesses about an extension or a layout calculation were not the reported diagnosis. Seeing the actual trace matters more than trusting the first plausible theory.
Anthropic describes the work as productive but not autonomous. Humans set ambition, chose tradeoffs and directed threads. I like being explicit that agents may continue exploring after hitting an initial target, as long as the measurement, review and rollback mechanisms are strong enough to support that exploration.
One example in the article had a model suggest waiting days for a baseline. A human said the team could merge and deploy promptly and encouraged it to be bolder. In my own work, I have seen models produce time estimates that do not reflect what a parallel agent workflow can actually do.
Wording can affect the range of options an agent considers. Asking for ambitious or unusual proposals may move it beyond a conservative first answer. I would not treat that as a license to merge risky changes without evidence: the useful result is a broader set of options that still has to be evaluated.
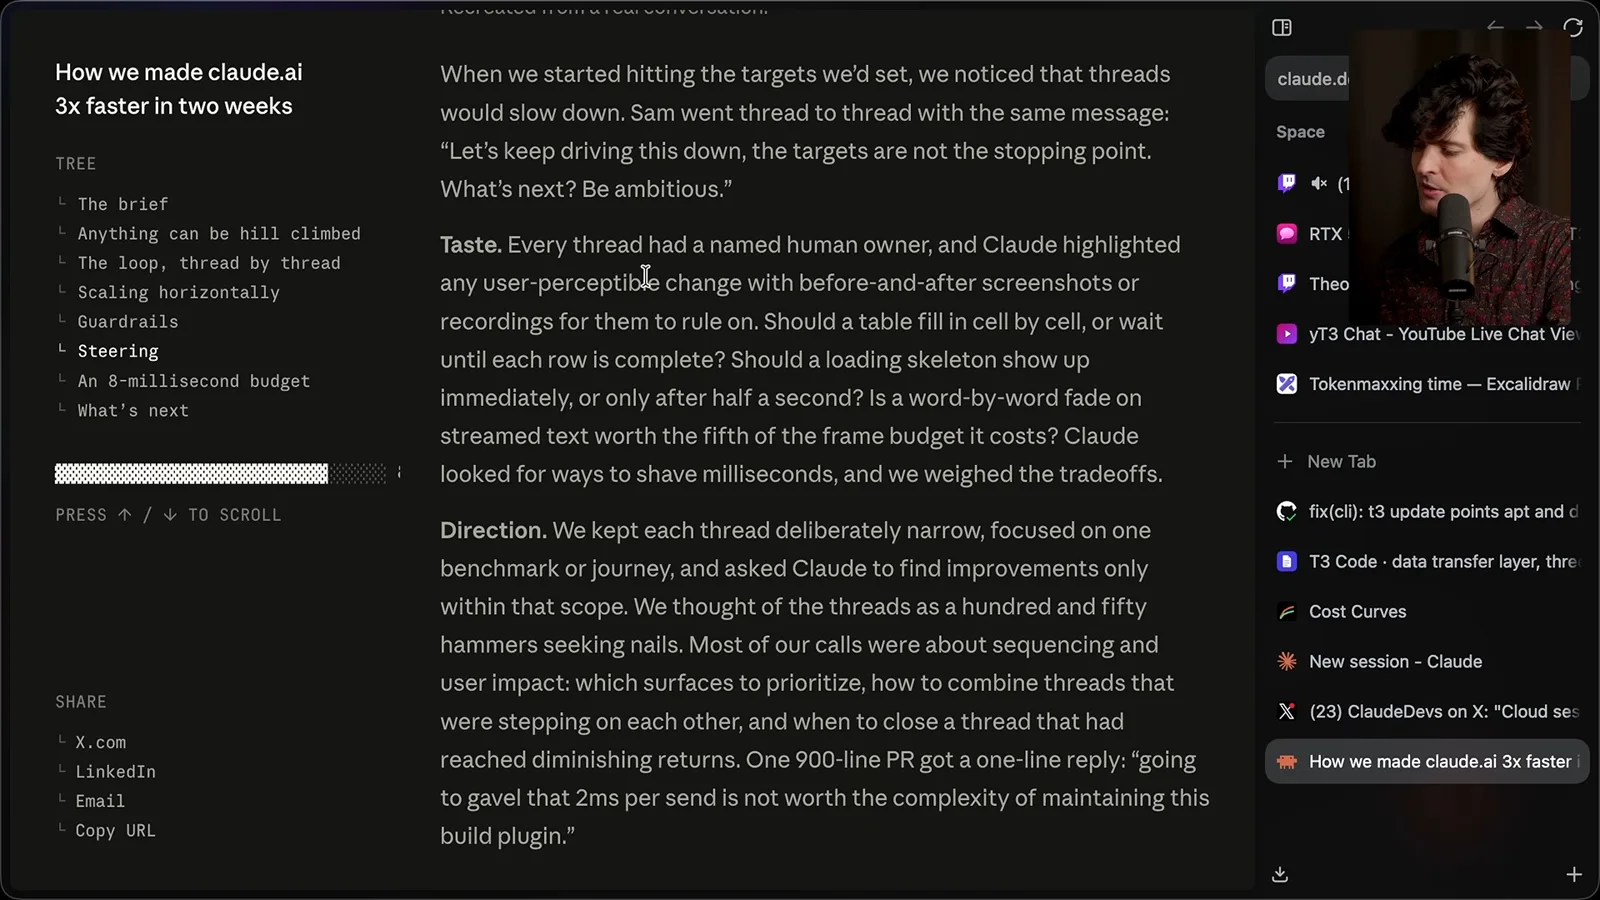
Each optimization thread had a named human owner. Claude showed screenshots or recordings of perceptible changes, and people decided questions such as when to show a skeleton, whether tables should appear incrementally and whether an animation justified its frame cost. Those choices involve user experience, not just an isolated benchmark.
For loading skeletons, I would look at the real distribution of wait times. Showing a skeleton for only a couple of frames just before data appears can be worse than showing nothing. The right threshold depends on the observed workload and the visual behavior users experience.
I personally dislike per-word fade animations and prefer receiving completed paragraphs or code blocks rather than partial tokens. T3 Code uses a different rendering approach to keep the page responsive. That is my preference; another product may make a different tradeoff based on its users and measurements.
I test how tables stream in Claude and see cells appear incrementally. I prefer waiting for a complete table, and I also dislike rendering incomplete code blocks because it can complicate highlighting. This is exactly why the article’s human-judgment section calls the decision a matter of taste.
Direction means keeping threads focused and deciding which work to prioritize or stop. The article describes a 900-line PR rejected because a two-millisecond improvement per send was not worth maintaining a new build plugin. Even a measurable gain can be a poor trade when the added complexity is disproportionate.
The 120 Hz frame budget and conclusion
A dedicated frame-stepping rig helps measure streamed responses. Theo closes with the value of giving agents reliable measurements before asking them to optimize.
One investigation aimed at a roughly 8.3-millisecond frame budget, the time available per frame at 120 Hz. The initial headless Chromium rig ran at 60 Hz, so Claude explored DevTools frame control and constructed a deterministic 120 Hz test. That turned smoothness into something the team could repeatedly measure.
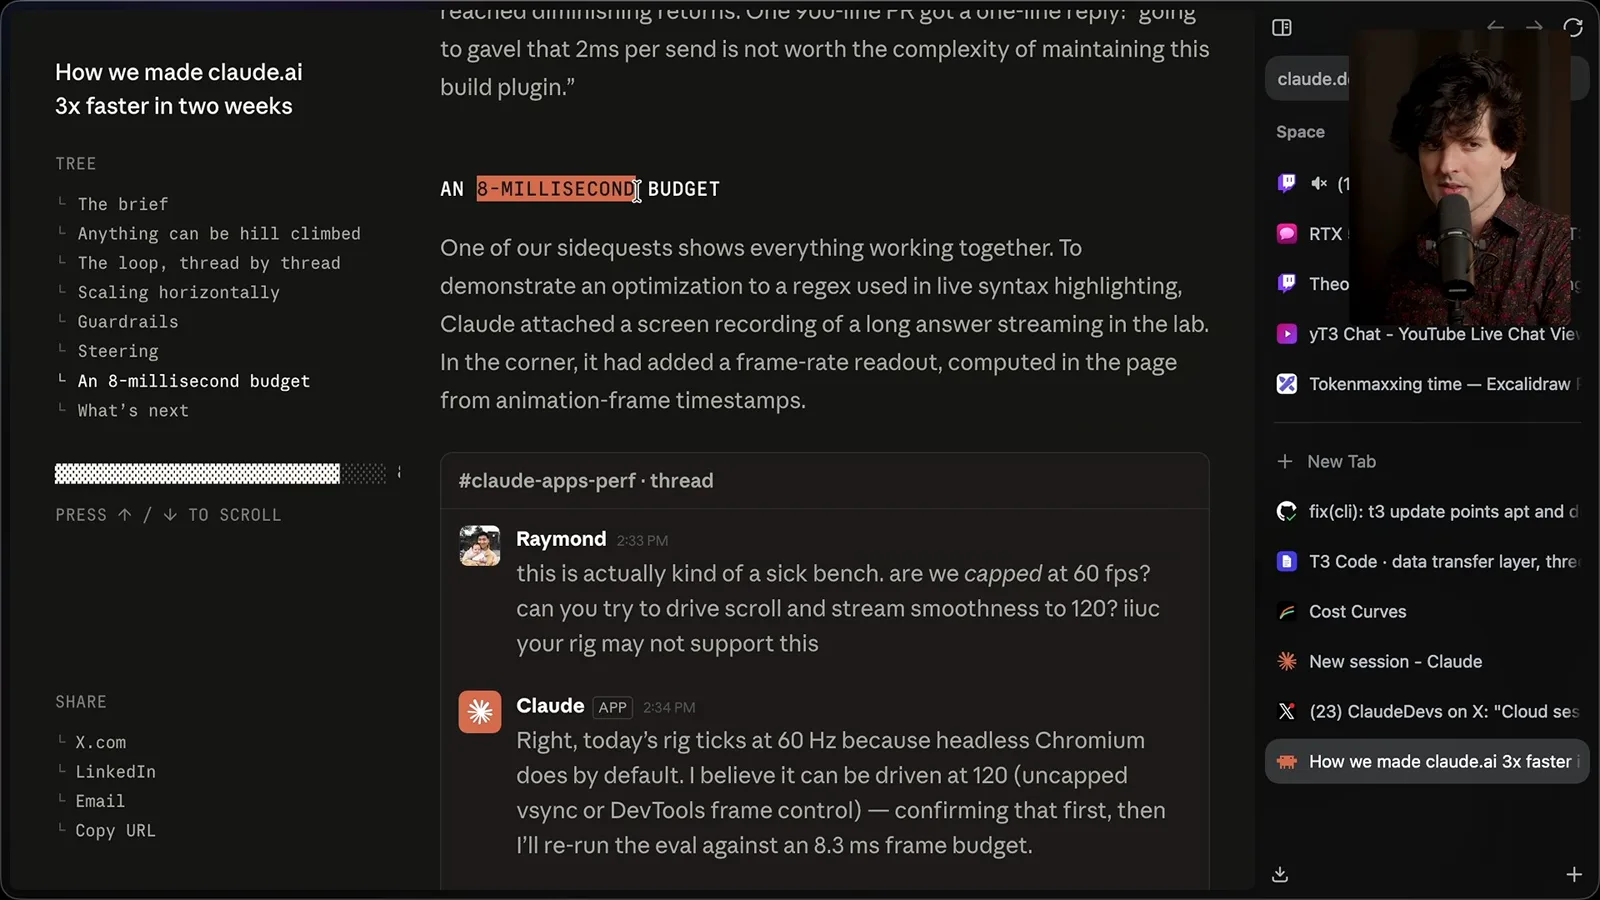
The Slack conversation in the article shows concise progress updates rather than every tool call. I find that appealing for some tasks: I want enough information to judge the result, but I do not always need to watch each command. Different tasks may demand different levels of detail.
The team stepped through a long streaming reply and found work that grew with message length on each chunk. It memoized completed blocks, moved tokenization of growing code fences to a worker, and chose cell-by-cell table rendering. I disagree with the last presentation choice, but the optimizations are distinct from that product decision.
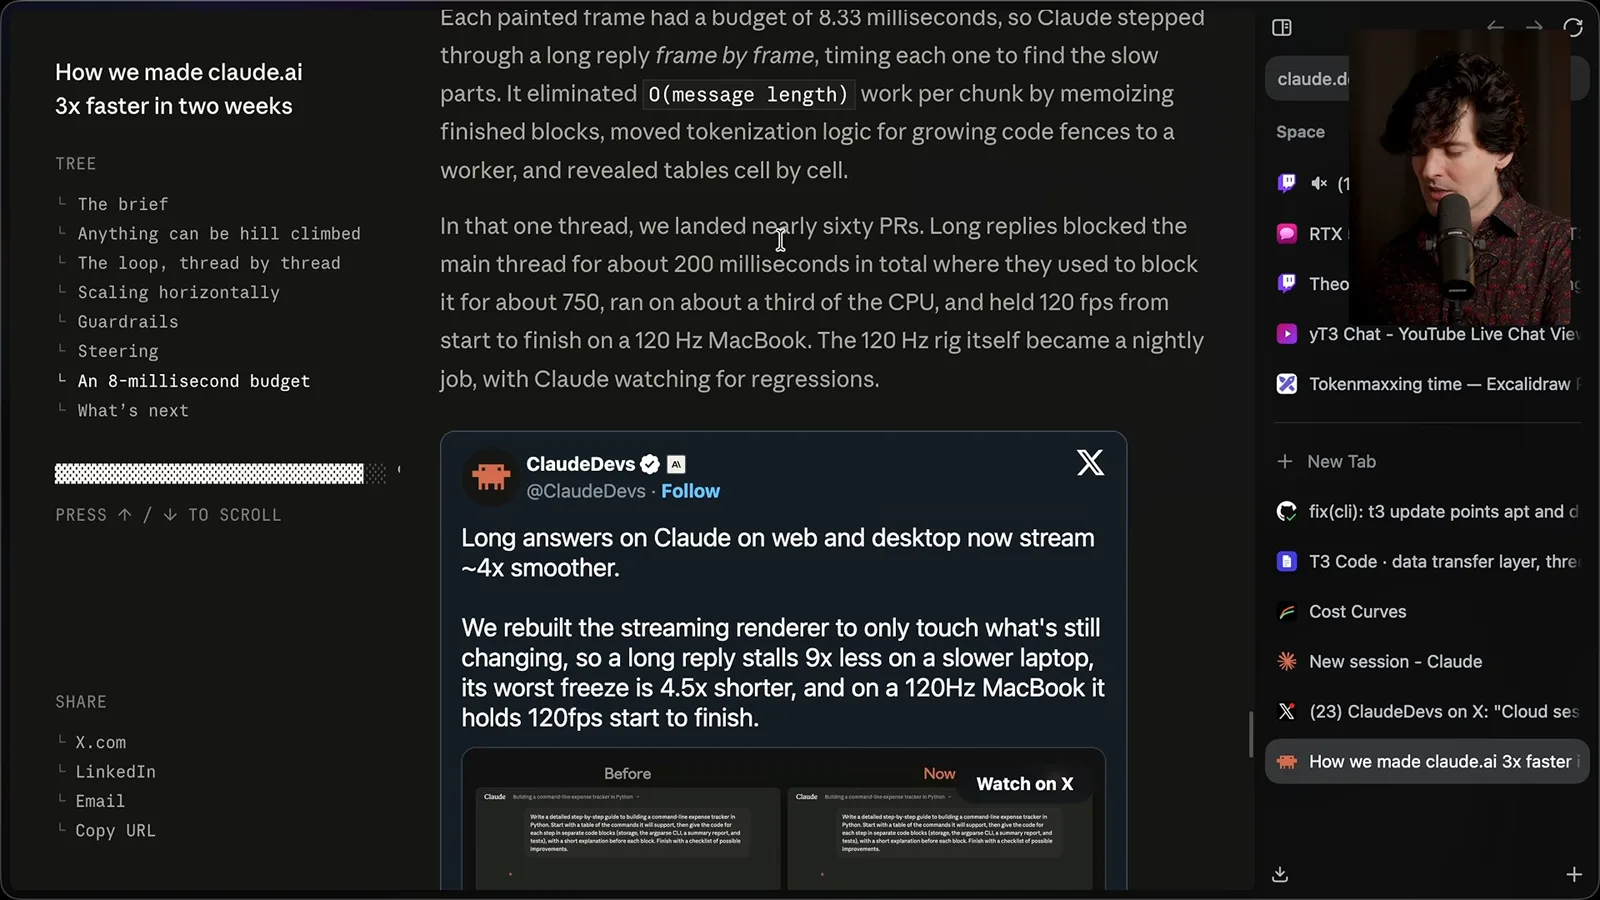
Anthropic reports nearly 60 PRs in that investigation. In its example, total main-thread blocking for long replies fell from about 750 milliseconds to 200, CPU use fell to around one third, and a 120 Hz MacBook held 120 frames per second through the reply. The new 120 Hz rig became a nightly regression job.
I had previously argued for streaming completed paragraphs, code blocks and tool calls rather than incomplete tokens. The article cites that discussion. Whatever rendering choice a team makes, it should test both the responsiveness and whether the result is comfortable to read.
Anthropic says 95th-percentile journeys and very long conversations still have room to improve, and it plans to discuss upstream contributions separately. I have been critical of Claude Desktop, but I have noticed improvement and appreciate the people working on it.
The conclusion I take from this is to ask the agent to find reliable ways to measure performance first, validate those measurements, and then pursue improvements. A vague request to make something faster invites guesses. A measured loop gives both the agent and its human reviewers evidence to work with.
There is still a human job: choose which user outcomes matter, examine the tradeoffs, test the product and decide whether the complexity is justified. Building that environment for agents is engineering work in its own right, and I enjoy getting to explore those problems again.
Sur la même chaîne
 36:07EN
 Theo - t3․gg· 27 oct. 2026Theo on Token Costs, Coding Agents, and the Price of AI CapabilityTheo Browne · Ping LabsA viral estimate of Lauren's AI spending prompts a closer look at cache pricing, benchmarks, and the changing work of coding agents.
 30:37ENTheo - t3․gg· 26 oct. 2026Theo’s Three Skills for Reviewing and Shipping with Coding AgentsTheo Browne · Ping LabsHow sol-loop, full-send and full-stop encode review, verification and different levels of merge authority.
 0:43ENTheo - t3․gg· 23 oct. 2026Theo Distinguishes Security Vulnerabilities from Active AttacksTheo Browne · Ping LabsA short explanation of why disclosed software flaws and reported attacks are different kinds of security news.
 29:22ENTheo - t3․gg· 22 oct. 2026Theo on Security Vulnerabilities, Stolen API Keys and AITheo Browne · Ping LabsA look at the gap between vulnerability disclosure and patching, and a speculative account of why stolen inference keys may be valuable.
 31:13ENTheo - t3․gg· 20 oct. 2026Theo on Why Smarter Models Help More Than DevelopersTheo Browne · Ping LabsFrom game modifications to compiler experiments, Theo revisits his assumptions about who benefits from more capable AI.
 31:47ENTheo - t3․gg· 18 oct. 2026Theo on Asking Agents for Outcomes and Building the Tools They NeedTheo Browne · Ping LabsA tool-call report, a troubleshooting playbook and connected data show how prompting can reshape product engineering.